Thứ Ba, 20 tháng 2, 2024

Nikkei Asia - Trung Quốc - Các thành phố nhỏ dư thừa nhà mới xây quá nhiều


Link: China's smaller cities face yearslong housing glut as sales languish - Nikkei Asia 

TÀI SẢN

Các thành phố nhỏ của Trung Quốc phải đối mặt với tình trạng dư thừa nhà ở kéo dài nhiều năm khi doanh số bán hàng suy giảm

Country Garden, Evergrande trả tiền cho việc mở rộng mạnh mẽ trong khu vực

PROPERTY

China's smaller cities face yearslong housing glut as sales languish

Country Garden, Evergrande pay for aggressive regional expansion

Phòng trưng bày Country Garden Holdings ở Thiều Quan vắng khách trong kỳ nghỉ Tết Nguyên đán. (Ảnh của Takashi Kawakami)

A Country Garden Holdings showroom in Shaoguan was short on customers during the Lunar New Year holiday. (Photo by Takashi Kawakami)

TAKASHI KAWAKAMI, biên tập viên Nikkei

Ngày 20 tháng 2 năm 2024 02:05 Giờ Nhật

川上 高師, Nikkei staff writer

February 20, 2024 02:05 JST

QUẢNG CHÂU - Các thành phố nhỏ hơn trong khu vực đang phải đối mặt với những tác động tồi tệ nhất của cuộc khủng hoảng thị trường nhà ở Trung Quốc, vì lượng hàng tồn kho dư thừa trong nhiều năm đè nặng lên các nhà phát triển tư nhân tập trung vào các khu vực đó.

GUANGZHOU -- Smaller regional cities are dealing with the worst effects of China's housing market woes, as years' worth of excess inventory weighs heavily on the private developers that have focused on those areas.

Một trong những thị trường khó tính nhất là Thiều Quan, một thành phố nội địa thuộc tỉnh Quảng Đông với dân số hơn 2,8 triệu người.

Among the toughest markets is Shaoguan, an inland city in Guangdong province with a population of over 2.8 million.

Một showroom của Country Garden Holdings ở đó gần đây đã cố gắng thu hút người dân về quê ăn Tết. Một nhân viên nhiệt tình mô tả các chương trình khuyến mãi được cung cấp, chẳng hạn như chỗ đậu xe miễn phí khi ký hợp đồng ngay tại chỗ và giảm giá 150.000 nhân dân tệ (20.800 USD) giúp giảm giá một chiếc xuống còn 850.000 nhân dân tệ. Nhưng khách hàng thì rất ít.

A Country Garden Holdings showroom there recently tried to attract people returning to their hometown for Lunar New Year. A staffer enthusiastically described the promotions on offer, such as free parking for signing a contract on the spot and a 150,000 yuan ($20,800) discount that cut the price of one unit to 850,000 yuan. But customers were few and far between.

Thiều Quan cách thủ phủ Quảng Châu của tỉnh khoảng 200 km về phía bắc - một chuyến đi kéo dài một giờ thậm chí bằng đường sắt cao tốc. Ngược lại với các thành phố ven biển phát triển cao như Quảng Châu và Thâm Quyến, nó có rất ít ngành công nghiệp đáng chú ý.

Shaoguan is about 200 kilometers north of the provincial capital of Guangzhou -- an hourlong trip even by high-speed rail. In contrast to highly developed coastal cities like Guangzhou and Shenzhen, it has little notable industry.

Tuy nhiên, hàng chục chung cư cao tầng từ các chủ đầu tư như Country Garden, China Evergrande và Poly Developments and Holdings vẫn mọc lên xung quanh ga đường sắt cao tốc ở trung tâm thành phố.

Yet dozens of high-rise condominiums from developers like Country Garden, China Evergrande and Poly Developments and Holdings have proliferated around the high-speed rail station in the city center.

Vào cuối năm 2023, Thiều Quan có thời gian giải quyết tồn kho lâu nhất – nguồn cung nhà ở theo khu vực, chia cho tổng diện tích các căn hộ đã ký hợp đồng gần đây – trong số 100 thành phố được Viện Nghiên cứu và Phát triển Trung Quốc E-House khảo sát, ở mức 131 tháng. Điều đó có nghĩa là phải mất hơn 10 năm để bán hết số hàng tồn kho.

At the end of 2023, Shaoguan had the longest inventory clearing time -- housing stock by area, divided by the total area of recently contracted units -- out of 100 cities examined by think tank E-House China Research and Development Institute, at 131 months. That means it would take more than 10 years to sell off all of the available stock.

“Họ đã xây quá nhiều nhà ở”, một cư dân lâu năm ở Thiều Quan nói. "Không có ai mua nó."

"They've built too much housing," a longtime Shaoguan resident said. "There's no one to buy it."

Các thành phố nhỏ như Thiều Quan đang tràn ngập nhà ở dư thừa.

Small cities like Shaoguan are awash in excess housing.

E-House đặt thời gian dọn dẹp trung bình cho 100 thành phố mà nó phân tích là khoảng 22 tháng, dài hơn nhiều so với mức 12 đến 14 tháng thường được coi là phù hợp. Thời gian trung bình của các thành phố cấp ba và cấp bốn thậm chí còn dài hơn, khoảng 30 tháng.

E-House put the average clearing time for the 100 cities it analyzed around 22 months, much longer than the 12 to 14 months typically seen as appropriate. The average for third- and fourth-tier cities was even longer, around 30 months.

Đối với các thành phố hạng nhất như Bắc Kinh, Thượng Hải và Thâm Quyến, thời gian trung bình chỉ là 17 tháng. Mặc dù đây vẫn chưa phải là một con số khả quan nhưng những người theo dõi thị trường hy vọng nó cho thấy điều tồi tệ nhất đã qua.

For first-tier cities such as Beijing, Shanghai and Shenzhen, the average came to just 17 months. Though this is still not a strong figure, market watchers hope it suggests that the worst has passed.

Nam Thâm Quyến, trung tâm của các công ty công nghệ như Tencent Holdings, có nhiều căn hộ với giá lên tới 100.000 nhân dân tệ mỗi mét vuông. Những bất động sản có giá trị tương đương hàng triệu đô la đôi khi được bán hết ngay lập tức. Mặc dù những thứ này nằm ngoài tầm với của những người lao động bình thường nhưng chúng được cho là sẽ thu hút những người mua giàu có đang tìm kiếm tài sản ở một vị trí tốt.

Southern Shenzhen, a hub for tech companies like Tencent Holdings, has many condos with prices topping 100,000 yuan per square meter. Properties with units priced at the equivalent of millions of dollars sometimes sell out right away. Though these are out of reach for normal workers, they are believed to attract wealthy buyers seeking assets in a good location.

Khoảng cách này đã gây khó khăn cho việc bán hàng của các công ty bất động sản tư nhân lớn đang mở rộng mạnh mẽ ở các thành phố nhỏ.

The gap has spelled trouble for the sales of big private real estate companies that expanded aggressively in small cities.

Country Garden, nhà phát triển bất động sản hàng đầu Trung Quốc theo hợp đồng bán hàng vào năm 2022, đã giảm xuống vị trí thứ sáu vào năm 2023 khi doanh số bán hàng của họ giảm một nửa, theo báo cáo của Trung tâm Nghiên cứu CRIC. Evergrande, từng cạnh tranh vị trí dẫn đầu vài năm trước, đã tụt xuống vị trí thứ 24 vào năm ngoái. Country Garden cho rằng việc họ không đánh giá đầy đủ nguy cơ đầu tư quá mức vào các thành phố nhỏ là một yếu tố dẫn đến sự sụt giảm.

Country Garden, China's top developer by contracted sales in 2022, dropped to sixth in 2023 as its sales plunged by half, CRIC Research Center reports. Evergrande, which had vied for the top spot a few years ago, tumbled to 24th last year. Country Garden cited its failure to fully appreciate the risk of overinvestment in small cities as a factor in the slump.

Trong khi đó, một số công ty nhà nước thực sự đã tăng doanh số bán hàng trong năm ngoái, chẳng hạn như China Oversea Land & Investment và C&D Real Estate, cả hai đều tập trung vào các thành phố hạng nhất và hạng hai. Những nhà phát triển này được hưởng lợi từ niềm tin thị trường cao hơn nhờ vị thế do nhà nước điều hành.

Meanwhile, some state-owned players actually increased sales last year, such as China Overseas Land & Investment and C&D Real Estate, which both focus on first- and second-tier cities. These developers benefit from higher market confidence due to their state-run status.

Với tình trạng dư thừa hàng tồn kho và nền kinh tế vẫn còn yếu kém, thị trường nhà ở Trung Quốc nói chung dự kiến sẽ tiếp tục suy thoái trong năm nay. Doanh số bán nhà mới xây theo khu vực đã giảm năm thứ hai liên tiếp vào năm 2023 và nhiều công ty nghiên cứu nhận thấy sẽ còn giảm nữa vào năm 2024.

With little progress on the inventory glut and the economy still weak, China's housing market as a whole is expected to remain in a slump this year. Sales of newly built homes fell by area for a second straight year in 2023, and many research firms see another drop in 2024.

Nếu điều này tiếp tục, các công ty như Country Garden và Evergrande có thể gặp khó khăn để đứng vững trở lại và nỗi đau có thể lan sang các nhà phát triển tư nhân khác.

If this continues, companies like Country Garden and Evergrande could struggle to get back on their feet, and the pain may spread to other private developers.

Thứ Hai, 19 tháng 2, 2024

Nguyễn Nhơn - Kiếp nạn 82 của ông Táo - Châm biếm thể chế "công an trị"

Nguồn: RFA Kiếp nạn 82 của ông Táo — Tiếng Việt (rfa.org) 

Kiếp nạn 82 của ông Táo

Châm biếm của blogger Nguyễn Nhơn (không phản ánh quan điểm của Đài Á Châu Tự Do)

2024.02.18

Hôm 23 tháng Chạp, nhà nhà Việt Nam ai nấy long trọng cúng ông Táo, nịnh nọt bày vô số món ăn ngọt lịm cầu mong ông về chầu Ngọc Hoàng cuối năm bình yên suôn sẻ, nói giùm gia chủ những lời ngọt ngào tốt đẹp để năm sau được nhiều may mắn.

Ai có mà dè, đến ngày 30 Tất niên, khi nhà nhà nô nức cúng rước ông Táo về lại thì mới té ngửa ra một sự động trời.

Ban đầu cũng không ai biết cả. Nhưng khi hương khói vừa thắp, ông bà Táo hiện hình hưởng lộc thì cả nhà ú òa. Trời ơi đi về Thiên đình ăn Tết mà sao ông nào ông nấy, bà nào bà nấy mặt mày hốc hác gầy sọm, tóc tai xơ xác. Đã không có quần thì chớ, còn mỗi cái áo mà nhăn nhíu hôi rình, hai vạt dài cuốn xoăn lên như bắp cải mùa đông, thảm không thể tả.

Vỡ lẽ

Làm sao thế này? Đường lên Thiên đình giờ không còn trạm thu phí nào, cao tốc cũng vừa xong trước tết, cá chép bay véo một cái thì đến. Căn bản không có trở ngại gì. Sao bọn họ cả thảy trông như đói ăn, nhếch nhác như bị đem bỏ chợ mấy ngày.

-Hu hu chủ nhân, lần sau đừng tin báo chí nữa. Thấy đứa báo chí nào đến nhà thì đuổi ngay.

-Không tin công an, công an càng to càng không tin.

Táo ông Táo bà một đoàn tiếp nối vừa khóc vừa căn dặn chủ nhân, làm các chủ nhân mặt cứ dài ra như cái thuổng vì kinh ngạc.

Trên toàn cõi Việt giới này người dám nghi ngờ công an thì chỉ có vợ hay chồng công an thôi, chứ dân thường-kể cả Táo thường đi nữa-ai cho cái gan to tày liếp ấy? Đang buôn bán anh ấy đến chỉ tay một cái bảo đóng cửa, vi phạm hành chính, thì vợ chồng con cái chỉ có nước treo mõm lên chứ nói lý được với công an à?

Các Táo trên đường lên Thiên đình lần này đã gặp phải chuyện gì mà bỗng như được tiêm máu gà thế chứ?

-Chúng tôi có được vào Thiên đình đâu. Cứ chò hõ ở khách sạn xem tổng kết qua live stream. Nhục ơi là nhục. Mạng thì cá mập nó cắn luôn, trông mặt Ngọc Hoàng lúc rõ lúc nhòe khổ ơi là khổ.

Hóa ra là do bởi tại vì cái căn cước.

Không làm phiền

Các Táo cụ trông coi bếp củi, bếp than, bếp trấu, đun lá khô đã mấy trăm năm nay, hồi trước được cấp giấy tờ tùy thân gọi là Chứng minh nhân dân, bằng giấy. Miếng giấy mỏng, chìa ra chìa vào mãi dễ nhàu rách, các cụ cẩn thận đem mấy lượt giấy bóng (nilon) gói lại, dùng bàn ủi than ủi qua tấm vải cho các nếp chết cứng để bảo vệ.

Nghe mãi đâm quen chứ ngẫm ra cái tên này quá vấn đề. Chứng minh nhân dân tức là chứng minh (người đang cầm nó) là nhân dân à? Thế có chứng minh cán bộ không?

Đến đời Táo bếp dầu khoảng 1980 thì vẫn là Chứng minh nhân dân. Nhưng lúc này cùng với bơm mực bút bi, đánh máy chữ, rút lốp-lộn xích xe đạp, ở miền Nam cũng có những người chạy chiếc xe đạp, sau lưng có cái thùng đựng chiếc bàn ủi con gà bằng đồng hay bằng gang đi ép Chứng minh nhân dân. Vẫn ép mẩu giấy lên tấm nilon rồi làm nóng nhưng tay chuyên hơn. Cực sáng tạo là các anh, chú dùng một bên chiếc phẹc mơ tuya đặt dọc từng cạnh của Chứng minh nhân dân, xếp miếng nilon dày lên rồi mới dùng bàn ủi nóng đè xuống. Nhựa nóng chảy theo răng cưa của phẹc mơ tuya tạo thành mép dán rất khít khao, đẹp như làm bằng máy.

Đời các Táo bếp ga thì có dịch vụ ép dẻo. Khắp kẻ chợ vùng quê ai cũng dùng cái dịch vụ này. Lúc này “soang” rồi, đã có điện và bình ắc quy. Anh thợ ép dẻo giấy tờ chở theo cái máy ép nhựa nóng, phương tiện hiện đại ép tuốt tuồn tuột tất cả các loại giấy tờ to nhỏ.

Bao nhiêu năm vẫn cái Chứng minh (mình là) nhân dân ấy.

Sang đời bọn Táo bếp từ, bếp hồng ngoại năm 2016 thì nhà nước bảo phải đổi Chứng minh nhân dân giấy sang thẻ Căn cước công dân, bằng nhựa cứng. Dân mình ngoan, Nhà nước bảo gì nghe nấy, thế là hì hục đi đổi. Mỗi người tốn cỡ vài chục đến 100 ngàn đồng. Đổi xong, thấy cái thẻ khá đẹp, lại nhựa cứng chắc, bền hơn mẩu giấy Chứng minh cũ là cái chắc, ai cũng nghĩ chỉ cần ép dẻo nó phòng nhét túi bị xước, thế là dùng thiên thu rồi, tiện phết.

Ai mà ngờ mới có vài năm sau lại phải đổi. Lần này là gắn chip.

Các cụ Táo củi, Táo than, Táo trấu… ai cũng già cả lọ mọ, đi vài bước cũng nhọc, suốt ngày chỉ thích ngồi trong bếp cho ấm thôi. Nên nghe phải đi đổi giấy tờ thì các cụ oải lắm.

Nhất là khi trên các giấy Chứng minh nhân dân cũ hay Căn cước công dân (không gắn chip) đều ghi rõ thời hạn sử dụng, ít nhất cũng vài năm nữa mới phải đổi.

Thế thì có nhất định phải đổi hết sang Căn cước gắn chip hay không?

-KHÔNGGGGGG!

Bộ Công an nói rõ to.

-Kính thưa các cụ, không phải đổi ạ. Chúng cháu khuyến khích các em Táo, cháu Táo mới được cấp căn cước lần đầu và các Táo nào đến hạn đổi thì đổi sang Căn cước gắn chip, thế thôi. Chứ giấy tờ vẫn còn hạn của các cụ Táo, ông Táo, bác Táo, anh Táo… như Chứng minh nhân dân này, Căn cước không gắn chip này… vẫn được sử dụng bình thường cho đến hết hạn sử dụng quy định trong luật ạ. Chúng cháu dứt khoát là không làm phiền các Táo đâu ạ. Ngành của chúng cháu là ngành phục vụ các Táo, vì Táo quên thân, vì Táo phục vụ ạ.

Trên tivi mới cả trên báo, Bộ Công an lại nói tiếp rõ to.

-Cảm ơn các chú thế chứ!

Các cụ Táo cười nở hết cả các nếp nhăn trên mặt.

Thế mà… ngờ đâu!

Đêm 23 tháng Chạp, các Táo kỵ, Táo cụ, Táo ông, Táo bác, Táo chú… lũ lượt khăn áo lên đường. Giấy tờ tùy thân tất nhiên là mang theo, gói kỹ trong túi.

Cá chép đang bay phơi phới đến cách Thiên đình 80 cây số thì gặp trạm kiểm soát đầu tiên. A cái này lạ, nhưng thôi, dạo này khủng bố linh tinh Ngọc Hoàng cẩn thận hơn trước cũng phải lẽ.

-Trình căn cước!

Một chú tre trẻ mặc áo xanh xanh nói chỏng lỏn, nhưng mà dõng dạc.

Các Táo lục đục móc giấy tờ.

-Gì đấy? Ở đâu đấy? Giờ này giờ nào còn xài cái này? Ai quản lý Táo này đấy?

Chú hất hàm vào Táo cụ đang lập cập đưa cái Chứng minh nhân dân giấy ra.

Táo cụ nghe lơ mơ nhưng linh cảm gặp chuyện rồi.

-Không duyệt, nhá. Ai có căn cước gắn chip thì vào. Ai không có dẹp hết sang hàng bên kia. Về!-Chú tre trẻ lại hất hàm.

Các Táo bắt đầu lao xao:

-Ơ thế là thế nào? Cái Chứng minh của mình không được à?

-Tôi có căn cước chưa gắn chip, có được không anh ơi? Mới làm mà?

Chú tre trẻ lên giọng:

-Tôi đã bảo không là không. Ai có căn cước gắn chip mới được vào Thiên đình, nhé.

-Bộ Công an bảo tất cả các giấy tờ còn hạn đều được dùng đến hết hạn cơ mà anh ơi, chúng tôi đọc báo nói rõ thế mà-một ông Táo nom quắc thước, mắt sáng rực chắc đọc báo nhìn rõ lắm, đứng ra đại diện.

-Tôi chả biết Bộ nào nói thế. Ở đây chúng tôi chỉ duyệt cho Táo nào có căn cước gắn chip thôi. Các cụ chưa làm thì về mà làm đi, không là chúng tôi không cho vào Thiên đình đâu đấy-Anh tre trẻ chém đinh chặt sắt nói.

Cáu quá, các cụ Táo tức lắm. Lại có cái chuyện láo thế à? Các cụ định kéo rốc vào Thiên đình kiện thẳng trước mặt Ngọc Hoàng cho bõ tức. Rõ cái quân láo lường, trẻ ranh dám coi lệnh quan trên không bằng cái cốc nhựa đựng cà phê vỉa hè của nó.

Nhưng mà… nó kéo cái barie lù lù ra ngồi sờ sờ đấy, không có căn cước gắn chip mả tổ của nhà nó thì chép nào bay qua được mà vào Thiên đình?

Ôm một bụng tức đầy căng cả ruột, một đoàn Táo đông như kiến cỏ quay chép tốc biến đến cái trạm thằng tre trẻ nó chỉ, để làm căn cước gắn chip cho kịp giờ chầu Ngọc Hoàng.

Nhưng…

Ai mà dè tập 2

Trong căn cước gắn chip mới được cấp, một Táo được ghi ngày sinh là 30/2 trước Công nguyên.

Một Táo ông được đổi giới tính thành Táo bà.

Một Táo được ghi địa chỉ thường trú: 249 đường Cây Gõ, Vùng Đáy đại dương, biển Baltic.

Một Táo, trong giấy báo số định danh ghi rõ tình trạng hôn nhân “Có gia đình” và ghi rõ tên vợ ông cùng số định danh của bà. Nhưng trong cái giấy báo số định danh của vợ ông thì ghi tình trạng hôn nhân: “Góa”.

Một Táo, nơi sinh bị ghi thành Vành đai Bắc Cực. Táo yêu cầu sửa cho đúng với khai sinh là Làng Ót, xã Ba Nghè, huyện Mụ Dạ tỉnh Thừa Thiên thì ba tháng sau được trả về căn cước mới, ghi: Vành đai Nam Cực.

Một Táo cũng bị ghi sai nơi sinh so với Chứng minh cũ. Lẽ ra cứ căn theo Chứng minh cũ để sửa thì công an đòi Táo phải về quê xin trích lục khai sinh mới sửa được. Nhưng Táo này là Táo Việt kiều hồi hương, từ Xích đạo về Việt Nam sinh sống đã vài chục năm rồi. Mang cả người thân về, giờ bên ấy chẳng còn ai. Mà bảo Táo nghỉ làm vài tuần để sang tận đấy xin trích lục khai sinh thì chủ nhà hàng không chịu. Táo nhà hàng mà bảo tắt bếp vài tuần thì khác nào bảo nhà hàng đóng cửa (mẹ nó) luôn cho rồi!

Đã thế còn tốn kém bao nhiêu.

Một Táo khác…

Lại một Táo khác…

Thôi thì Táo ông Táo bà, Táo cụ Táo kỵ, Táo con Táo cháu vừa khóc vừa kể vừa phẫn nộ, gia chủ ù hết cả hai tai.

Tất tần tật sai sót nhầm lẫn của cơ quan công an đổ hết lên đầu các Táo. Các Táo vừa phải đóng thêm tiền để làm lại căn cước (có khi sai đến ba lần, đóng gấp ba lần tiền), vừa tốn kém quá nhiều thời gian tắt bếp đi làm lại giấy tờ. Vô số gia đình ở hạ giới đang nấu cơm thì hết gaz, đang nấu cháo thì cúp điện. Cứ tưởng sự cố, nhưng không phải nhé. Đấy chính là do ông bà Táo ở nhà bị sai căn cước nên phải tranh thủ đi làm lại.

Trễ giấy tờ nên không được vào diện kiến Ngọc Hoàng, hết tiền nên thuê ở phòng dorm để dành tiền mua thức ăn cho chép, đặng còn có phương tiện về trần. Mạng thì phập phù, nên khi tổng kết Thiên đình online thì Táo nhìn mặt Ngọc Hoàng méo mó biến dạng, là cái chuyện như thế.

Kiếp nạn thứ 82

Trải qua chín chín tám mốt kiếp nạn, cuối cùng các Táo cũng có được cái thẻ căn cước gắn chip mới tinh, ảnh in màu sáng loáng, quốc huy đỏ chót cứng khự giắt túi. Chép toàn ngửi hơi nhang từ hôm 23 Tết đến giờ đói thủng cả bụng rồi, nên khi Ngọc Hoàng réo rắt cất tiếng chào tiễn biệt thì chép nào Táo nấy quay đầu phóng vun vút về hạ giới.

Ôi thôi gặp lại nhau mừng mừng tủi tủi. Tiệc tẩy trần, gia chủ quyết đoán bày lên một bàn đầy ắp, toàn các món đông lạnh. Gì thì gì cũng phải để Táo nghỉ ngơi hoàn hồn đã chứ!

Chén đầy chén vơi, cụng ly đôm đốp. Được vài tuần rượu, mặt các Táo đã hồng lên, niềm vui và sinh khí dần trở lại. Dzô đi anh em!

Đúng lúc ấy, cái tivi treo tường đang chạy bản tin thời sự cuối năm bỗng gióng giả du dương:

-Luật căn cước mới có hiệu lực thi hành từ 01/7/2024. Luật mới lược bỏ vân tay và sửa đổi quy định về thông tin số căn cước, theo đó “Căn cước công dân” đổi thành “Căn cước”. Các thông tin khác như quê quán, nơi thường trú, chữ ký của người cấp thẻ" thành "nơi đăng ký khai sinh, nơi cư trú, số định danh cá nhân…". Việc thay đổi, cải tiến như trên để tạo thuận lợi hơn cho người dân trong quá trình sử dụng căn cước, hạn chế việc phải cấp đổi căn cước và bảo đảm tính riêng tư của người dân.

Ầm!

Đùng!

Oàng!

Bịch!

Phòng tiệc đang vô cùng hân hoan bỗng liên tiếp vang lên những âm thanh lạ. Gia chủ vừa mở tủ lạnh lấy thêm thức ăn quay lại thì thấy ghế trống trơn, bàn xiêu đổ. Tất tần tật các Táo đã ngã lăn chiêng ra đất, mặt úp xuống, mắt trợn trắng hoặc nhắm nghiền như đã chặt hết duyên nợ nhân sinh mà đi!

________

Tham khảo:

https://plo.vn/dan-gap-kho-vi-cccd-sai-thong-tin-sai-so-dinh-danh-post712262.html

https://tuoitre.vn/luat-can-cuoc-tu-1-7-2024-can-cuoc-cong-dan-cu-su-dung-ra-sao-20231225091847927.htm

* Bài châm biếm không thể hiện quan điểm của Đài Á Châu Tự Do.

* Nguyễn Nhơn là nhà báo Việt Nam hiện đang sống ở Thái Lan. Nhà báo Nguyễn Nhơn quan tâm đến tình hình đất nước và viết nhiều bài về các vấn đề chính trị và xã hội trong nước.

Chủ Nhật, 18 tháng 2, 2024

Nguyễn-Xuân Nghĩa: CỤC DIỆN GIÁP THÌN 2024 - AN NINH và KINH TẾ TOÀN CẦU…

 Nguyễn-Xuân Nghĩa:

CỤC DIỆN GIÁP THÌN - AN NINH và KINH TẾ TOÀN CẦU…

Lẽ chiến hòa tùy khả năng sản xuất - từ cơm áo gạo tiền đến võ khí – và còn tùy định nghĩa của ‘chiến thắng’ với ‘hòa đàm’…

Năm Giáp Thìn 2024 vừa mở ra đã thấy quá nhiều biến động và rủi ro chỉ vì tiếp nhận bao vấn đề tích lũy từ quá khứ gần xa. Giải trình sự kiện và dự báo tương lai cho tạm đủ thì cần viết… một cuốn sách! Thôi đành ‘liệu cơm gắp mắm’, xin thu gọn vào một số đề tài rồi tùy khả năng và thời giờ mà gõ ra, yết lại từng bài cỡ hai ngàn chữ. 

Chỉ mong là nếu thấy có ích, quý vị tự ý chia sẻ và phổ biến thêm….

I - AN NINH CŨNG LÀ KINH TẾ…

Thế giới đang có hai lò lửa là 

1) cuộc chiến Ukraine trong khu vực Đông Âu do Putin của Liên bang Nga phát động từ 24 Tháng Hai, 2022; 

2) cuộc chiến Israel tại Trung Đông do khủng bố Hamas phát động ngày bảy Tháng 10, 2023, từ Dải Gaza. 

Cả hai cuộc chiến có nguyên nhân sâu xa và bùng nổ trước sự suy nhược của khối dân chủ Tây phương, kể cả Hoa Kỳ, và chính Israel. 


Bên cạnh, thế giới cũng có rủi ro chiến tranh tại khu vực Đông Á, với Bắc Hàn cộng sản và Trung Cộng chủ động gây ra. Điểm nóng chính là Đài Loan, và ngay sau lưng Đài Loan là Nhật Bản, cùng các quốc gia bán đảo hay quần đảo tại Đông Nam Á. Và siêu cường Hoa Kỳ.

Chúng ta khởi đầu với một quy luật quái đản là các nước dân chủ tiên tiến đều gặp khó khăn kinh tế - một phần là do… chiến tranh! 

Theo thống kê Tháng 12, 2023 của Ngân hàng Thế giới (WB), sản lượng 10 nước dẫn đầu (tên và số liệu GDP bằng ngàn tỷ Mỹ kim) là: Hoa Kỳ 25,4; Trung Cộng 18,0; Nhật Bản 4,2; Đức 4,1; Ấn Độ 3,4; Anh 3,1; Pháp 2,8; Nga 2,2; Canada 2,1; và Ý 2,0 ngàn tỷ.

Nhưng đó là số liệu… cũ! 

Thật ra, Cộng hòa Liên bang Đức bị suy trầm kinh tế từ năm ngoái, và do chiến cuộc Ukraine nên tham gia trừng phạt bạn hàng từ 30 năm, là Liên bang Nga. Lại do chiến cuộc Israel, nguồn cung ứng năng lượng lên giá khiến Đức khó cạnh tranh với hai đối thủ về chế biến, là Tầu và Nhật.

Tuần qua, thêm kinh tế Nhật và Anh bị suy trầm – một phần cũng do yếu tố an ninh, là chi phí cho quân viện! Sản lượng GDP của Nhật có thua Đức thì cũng chẳng làm thiên hạ giật mình, nếu nhìn cục diện với chiều sâu hơn. Nối tiếp Đức, Nhật, Anh, có Canada và Ý đang xếp hàng chờ ngày suy trầm!

Đâm ra, Hoa Kỳ lại có vẻ bảnh nhất, về chính sách thì không nhờ Bidenomics mà do Ngân hàng Trung ương và Thống đốc Jerome Powell! Và then chốt là nhờ đặc tính kinh tế rộng lớn, ít lệ thuộc vào xuất cảng như Tầu, Nhật và Đức, lại có nguồn năng lượng riêng, dù có bị Joe Biden phá hoại thì vẫn đủ cung ứng cho nhu cầu. Cứ nhìn giá dầu thô thì ta biết - mà bọn (đảng) Dân Chủ và Vẹt kiều (Mỹ) chỉ nhìn vào rốn để làm thông dịch viên cho đảng, nên ngu vẫn hoàn ngu.

Tức là an ninh cũng ảnh hưởng đến kinh tế của các nước. Khi đó, ta ngó kỹ vào việc Thượng Viện Mỹ đã đáp ứng yêu cầu của Chính quyền Biden mà dự chi thêm 61 tỷ cho Ukraine để kéo dài khả năng cầm cự.

Cái giá chính trị là những gì, chúng ta sẽ tìm hiểu khi liếc qua tình hình chiến trường nóng và lạnh… (Vừa gõ vừa đếm chữ để… viết ít hiểu nhiều, hèn chi vất vả…)

---

[Đây là vài món ăn chơi, khi cuối tuần hơi hung hăng tiến tới!]


Nguyễn Xuân Nghĩa - Huyền thoại Trung Quốc (I) Trung Quốc Vĩ Đại và những Vấn Đề Vĩ Đại (20 Tháng Chín 2009)


Thứ Sáu, 16 tháng 2, 2024

Greenhouse Gases - Khí nhà kính

Trên thế giới, mọi người đều đổ lỗi cho việc tăng nhiệt độ toàn cầu là do CO2. Nhưng họ cứ nói một cách "cả vú lấp miệng em như vậy" - chứ tôi chưa tìm thấy một công trình khoa học nào chứng minh sự liên hệ mật thiết rõ ràng giữa CO2 và tăng nhiệt độ. Khi bạn khẳng định một chuyện gì đó, bạn cần chứng mình mối liên hệ rõ ràng. Những thứ không chứng minh được thì cần thêm chữ "thuyết" vào trước, như "thuyết tiến hóa", "thuyết nhân quả", "thuyết định mệnh", vân vân, mây mây...

Cứ cho rằng là CO2 là thủ phạm trực tiếp của hiện tượng tăng nhiệt độ toàn cầu, nhưng giải pháp là chuyển từ các loại động cơ xe xăng thành xe điện thì có thật sự là giải pháp không? Điện được sản xuất từ cái giống gì?

Overview of Greenhouse Gases

On this page:

Gases that trap heat in the atmosphere are called greenhouse gases. This section provides information on emissions and removals of the main greenhouse gases to and from the atmosphere. For more information on the other climate forcers, such as black carbon, please visit the Climate Change Indicators: Climate Forcing page.

  • Carbon dioxide (CO2): Carbon dioxide enters the atmosphere through burning fossil fuels (coal, natural gas, and oil), solid waste, trees and other biological materials, and also as a result of certain chemical reactions (e.g., cement production). Carbon dioxide is removed from the atmosphere (or "sequestered") when it is absorbed by plants as part of the biological carbon cycle.
  • Methane (CH4): Methane is emitted during the production and transport of coal, natural gas, and oil. Methane emissions also result from livestock and other agricultural practices, land use, and by the decay of organic waste in municipal solid waste landfills.
  • Nitrous oxide (N2O): Nitrous oxide is emitted during agricultural, land use, and industrial activities; combustion of fossil fuels and solid waste; as well as during treatment of wastewater.
  • Fluorinated gases: Hydrofluorocarbons, perfluorocarbons, sulfur hexafluoride, and nitrogen trifluoride are synthetic, powerful greenhouse gases that are emitted from a variety of household, commercial, and industrial applications and processes. Fluorinated gases (especially hydrofluorocarbons) are sometimes used as substitutes for stratospheric ozone-depleting substances (e.g., chlorofluorocarbons, hydrochlorofluorocarbons, and halons). Fluorinated gases are typically emitted in smaller quantities than other greenhouse gases, but they are potent greenhouse gases. With global warming potentials (GWPs) that typically range from thousands to tens of thousands, they are sometimes referred to as high-GWP gases because, for a given amount of mass, they trap substantially more heat than CO2.

Each gas's effect on climate change depends on three main factors:

How abundant are greenhouse gases in the atmosphere?

Concentration, or abundance, is the amount of a particular gas in the air. Larger emissions of greenhouse gases lead to higher concentrations in the atmosphere. Greenhouse gas concentrations are measured in parts per million, parts per billion, and even parts per trillion. One part per million is equivalent to one drop of water diluted into about 13 gallons of liquid (roughly the fuel tank of a compact car). To learn more about the increasing concentrations of greenhouse gases in the atmosphere, visit the Climate Change Indicators: Atmospheric Concentrations of Greenhouse Gases page.

How long do greenhouse gases stay in the atmosphere?

Each of these gases can remain in the atmosphere for different amounts of time, ranging from a few years to thousands of years. All of these gases remain in the atmosphere long enough to become well mixed, meaning that the amount that is measured in the atmosphere is roughly the same all over the world, regardless of the source of the emissions.

How strongly do greenhouse gases impact the atmosphere?

Some gases are more effective than others at making the planet warmer and "thickening the Earth's atmospheric blanket."

For each greenhouse gas, a Global Warming Potential (GWP) was developed to allow comparisons of the global warming impacts of different gases. Specifically, it is a measure of how much energy the emissions of 1 ton of a gas will absorb over a given period of time, typically a 100-year time horizon, relative to the emissions of 1 ton of carbon dioxide (CO2). Gases with a higher GWP absorb more energy, per ton emitted, than gases with a lower GWP, and thus contribute more to warming Earth.

Note: All emission estimates are from the Inventory of U.S. Greenhouse Gas Emissions and Sinks: 1990–2021The Inventory uses 100-year GWPs from IPCC’s Fifth Assessment Report (AR5).

Carbon Dioxide Emissions

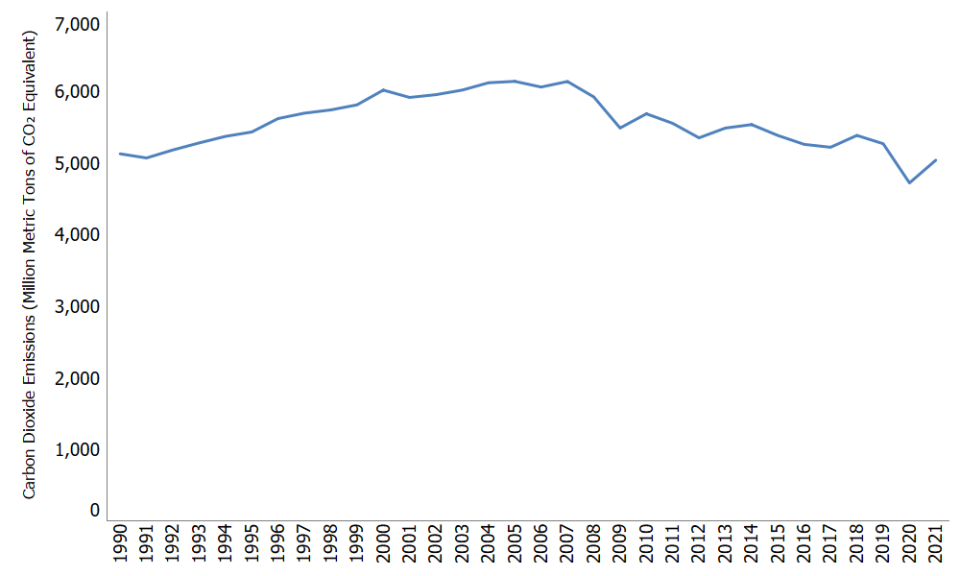
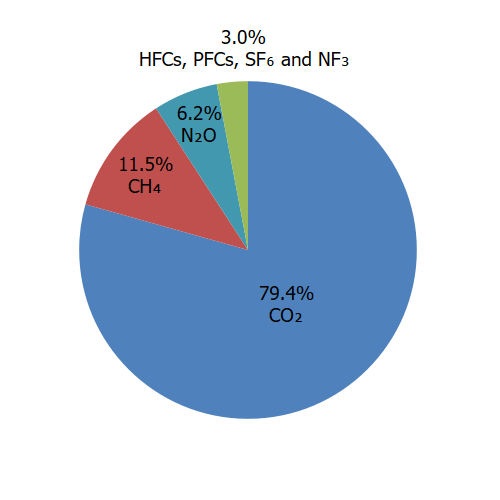
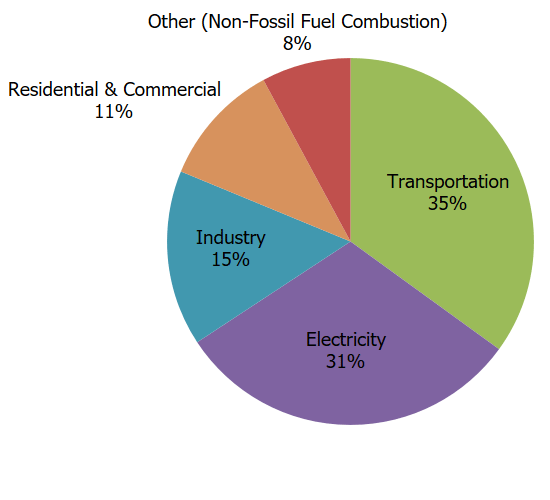
Carbon dioxide (CO2) is the primary greenhouse gas emitted through human activities. In 2021, CO2 accounted for 79% of all U.S. greenhouse gas emissions from human activities. Carbon dioxide is naturally present in the atmosphere as part of the Earth's carbon cycle (the natural circulation of carbon among the atmosphere, oceans, soil, plants, and animals). Human activities are altering the carbon cycle–both by adding more CO2 to the atmosphere and by influencing the ability of natural sinks, like forests and soils, to remove and store CO2 from the atmosphere. While CO2 emissions come from a variety of natural sources, human-related emissions are responsible for the increase that has occurred in the atmosphere since the industrial revolution.2

The main human activity that emits CO2 is the combustion of fossil fuels (coal, natural gas, and oil) for energy and transportation. Certain industrial processes and land-use changes also emit CO2. The main sources of CO2 emissions in the United States are described below.

  • Transportation. The combustion of fossil fuels such as gasoline and diesel to transport people and goods was the largest source of CO2 emissions in 2021, accounting for 35% of total U.S. CO2 emissions and 28% of total U.S. greenhouse gas emissions. This category includes domestic transportation sources such as highway and passenger vehicles, air travel, marine transportation, and rail.
  • Electricity. Electricity is a key source of energy in the United States and is used to power homes, business, and industry. In 2021, the combustion of fossil fuels to generate electricity was the second largest source of CO2 emissions in the nation, accounting for 31% of total U.S. CO2 emissions and 24% of total U.S. greenhouse gas emissions. The types of fossil fuel used to generate electricity emit different amounts of CO2. To produce a given amount of electricity, burning coal will produce more CO2 than natural gas or oil.
  • Industry. Many industrial processes emit CO2 through fossil fuel consumption. Several processes also produce CO2 emissions through chemical reactions that do not involve combustion, and examples include the production of mineral products such as cement, the production of metals such as iron and steel, and the production of chemicals. The fossil fuel combustion component of various industrial processes accounted for 15% of total U.S. CO2 emissions and 12% of total U.S. greenhouse gas emissions in 2021. Many industrial processes also use electricity and therefore indirectly result in CO2 emissions from electricity generation.

Carbon dioxide is constantly being exchanged among the atmosphere, ocean, and land surface as it is both produced and absorbed by many microorganisms, plants, and animals. Emissions and removals of CO2 by these natural processes, however, tend to balance over time, absent anthropogenic impacts. Since the Industrial Revolution began around 1750, human activities have contributed substantially to climate change by adding CO2 and other heat-trapping gases to the atmosphere.

In the United States, the management of forests and other land (e.g., cropland, grasslands, etc.) has acted as a net sink of CO2, which means that more CO2 is removed from the atmosphere, and stored in plants and trees, than is emitted. This carbon sink offset about 13% of total emissions in 2021. For more details, see the discussion in the Land Use, Land-Use Change, and Forestry section.

To find out more about the role of CO2 in warming the atmosphere and its sources, visit the Climate Change Indicators page.

Trends

Carbon dioxide emissions in the United States decreased by 2% between 1990 and 2021. Since the combustion of fossil fuel is the largest source of greenhouse gas emissions in the United States, changes in emissions from fossil fuel combustion have historically been the dominant factor affecting total U.S. emission trends. Changes in CO2 emissions from fossil fuel combustion are influenced by many long-term and short-term factors, including population growth, economic growth, changing energy prices, new technologies, changing behavior, and seasonal temperatures. In 2021, the increase in CO2 emissions from fossil fuel combustion corresponded with an increase in energy use as a result of economic activity rebounding after the height of the COVID-19 pandemic, in addition to an increase in coal use in the electric power sector.

Reducing Carbon Dioxide Emissions

The most effective way to reduce CO2 emissions is to reduce fossil fuel consumption. Many strategies for reducing CO2 emissions from energy are cross-cutting and apply to homes, businesses, industry, and transportation.

Examples of Reduction Opportunities for Carbon Dioxide
StrategyExamples of How Emissions Can be Reduced
Energy Efficiency

Improving the insulation of buildings, traveling in more fuel-efficient vehicles, and using more efficient electrical appliances are all ways to reduce energy use, and thus CO2 emissions.

Energy Conservation

Reducing personal energy use by turning off lights and electronics when not in use reduces electricity demand. Reducing distance traveled in vehicles reduces petroleum consumption. Both are ways to reduce energy CO2 emissions through conservation.

Learn more about What You Can Do at Home, at School, in the Office, and on the Road to save energy and reduce your carbon footprint.

Fuel Switching

Producing more energy from renewable sources and using fuels with lower carbon contents are ways to reduce carbon emissions.

Carbon Capture and Sequestration (CCS)

Carbon dioxide capture and sequestration is a set of technologies that can potentially greatly reduce CO2 emissions from new and existing coal- and gas-fired power plants, industrial processes, and other stationary sources of CO2. For example, a CCS project might capture CO2 from the stacks of a coal-fired power plant before it enters the atmosphere, transport the CO2 via pipeline, and inject the CO2 deep underground at a carefully selected and suitable subsurface geologic formation, such as a nearby abandoned oil field, where it is securely stored.

Learn more about CCS.

Changes in Uses of Land and Land Management Practices

Learn more about Land Use, Land Use Change and Forestry Sector.

1 Atmospheric CO2 is part of the global carbon cycle, and therefore its fate is a complex function of geochemical and biological processes. Some of the excess carbon dioxide will be absorbed quickly (for example, by the ocean surface), but some will remain in the atmosphere for thousands of years, due in part to the very slow process by which carbon is transferred to ocean sediments.

2IPCC (2021). Climate Change 2021: The Physical Science Basis. Contribution of Working Group I to the Sixth Assessment Report of the Intergovernmental Panel on Climate Change [Masson-Delmotte, V., P. Zhai, A. Pirani, S.L. Connors, C. Péan, S. Berger, N. Caud, Y. Chen, L. Goldfarb, M.I. Gomis, M. Huang, K. Leitzell, E. Lonnoy, J.B.R. Matthews, T.K. Maycock, T. Waterfield, O. Yelekçi, R. Yu, and B. Zhou (eds.)]. Cambridge University Press, Cambridge, United Kingdom and New York, NY, USA, 2391 pp.

Methane Emissions

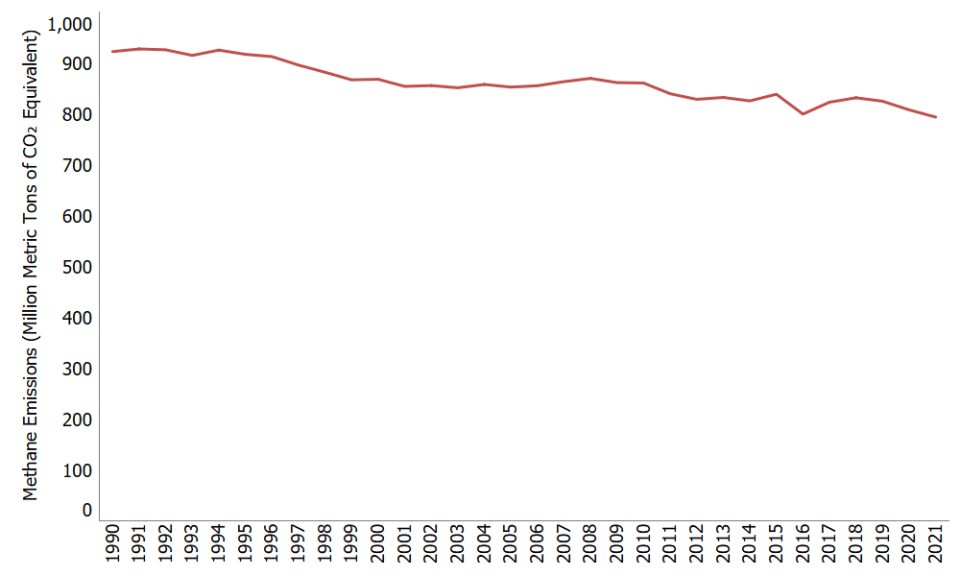
In 2021, methane (CH4) accounted for 12% of all U.S. greenhouse gas emissions from human activities. Human activities emitting methane include leaks from natural gas systems and the raising of livestock. Methane is also emitted by natural sources such as termites. In addition, natural processes in soil and chemical reactions in the atmosphere help remove CH4 from the atmosphere. Methane's lifetime in the atmosphere is much shorter than carbon dioxide (CO2), but CH4 is more efficient at trapping radiation than CO2. Pound for pound, the comparative impact of CH4 is 28 times greater than CO2 over a 100-year period.1

Globally, 50-65% of total CH4 emissions come from human activities.2 Methane is emitted from energy, industry, agriculture, land use, and waste management activities, described below.

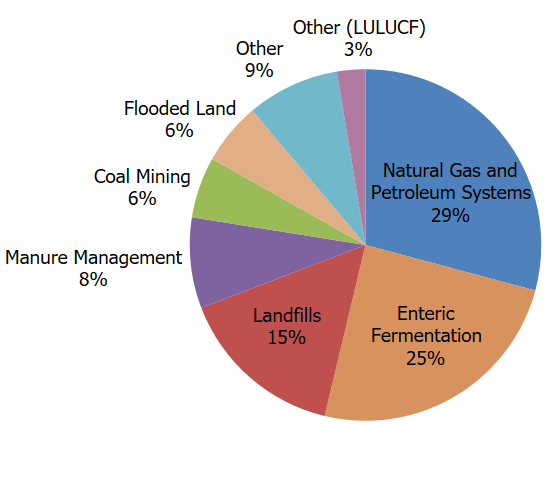
  • Agriculture. Domestic livestock such as cattle, swine, sheep, and goats produce CH4 as part of their normal digestive process. Also, when animal manure is stored or managed in lagoons or holding tanks, CH4 is produced. Because humans raise these animals for food and other products, the emissions are considered human-related. The Agriculture sector is the largest source of CH4 emissions in the United States. For more information, see the Inventory of U.S. Greenhouse Gas Emissions and Sinks Agriculture chapter.
  • LULUCF: While not shown in the figure, emissions of CH4 also occur as a result of land use and land management activities in the Land Use, Land-Use Change, and Forestry sector (e.g. forest and grassland fires, management of flooded lands such as reservoirs, decomposition of organic matter in coastal wetlands).
  • Energy and Industry. Natural gas and petroleum systems are the second largest source of CH4 emissions in the United States. Methane is emitted to the atmosphere during the production, processing, storage, transmission, distribution, and use of natural gas, and the production, refinement, transportation, and storage of crude oil. Coal mining is also a source of CH4 emissions. For more information, see the Inventory of U.S. Greenhouse Gas Emissions and Sinks sections on Natural Gas Systems and Petroleum Systems.
  • Waste from Homes and Businesses. Methane is generated in landfills as waste decomposes and in the treatment of wastewater. Landfills are the third-largest source of CH4 emissions in the United States. Methane is also generated from domestic and industrial wastewater treatment and from composting and anaerobic digestion. For more information, see the Inventory of U.S. Greenhouse Gas Emissions and Sinks Waste chapter.

Methane is also emitted from a number of natural sources. Natural wetlands that are not managed or changed by human activity are the largest source, emitting CH4 from bacteria that decompose organic materials in the absence of oxygen. Reservoirs and ponds with high organic matter and low oxygen levels also produce methane through the microbial breakdown of organic matter. Smaller sources include termites, oceans, sediments, volcanoes, and wildfires. 

To find out more about the role of CH4 in warming the atmosphere and its sources, visit the Climate Change Indicators page.

Trends

Methane emissions in the United States decreased by 16% between 1990 and 2021. During this time period, emissions increased from sources associated with agricultural activities, while emissions decreased from other sources including landfills and coal mining and from natural gas and petroleum systems.

Reducing Methane Emissions

There are a number of ways to reduce CH4 emissions. Some examples are discussed below. EPA has a series of voluntary programs for reducing CH4 emissions, in addition to regulatory initiatives. EPA also supports the Global Methane Initiative, an international partnership encouraging global methane reduction strategies.

Examples of Reduction Opportunities for Methane
Emissions SourceHow Emissions Can be Reduced
Industry

Upgrading the equipment used to produce, store, and transport oil and natural gas can reduce many of the leaks that contribute to CH4 emissions. Methane from coal mines can also be captured and used for energy. Learn more about the EPA's Natural Gas STAR Program and Coalbed Methane Outreach Program.

Agriculture

Methane from manure management practices can be reduced and captured by altering manure management strategies. Additionally, modifications to animal feeding practices may reduce emissions from enteric fermentation. Learn more about improved manure management practices at EPA's AgSTAR Program.

Waste from Homes and Businesses

Capturing landfill CH4 for destruction in a flare or conversion to renewable energy are both effective emission reduction strategies. Learn more about these opportunities and the EPA's Landfill Methane Outreach Program.  Additionally, managing waste at a higher tier on the waste management hierarchy can reduce CH4 generation at landfills. Learn more about Sustainable Materials Management.

References

1IPCC (2013). Climate Change 2013: The Physical Science Basis. Contribution of Working Group I to the Fifth Assessment Report of the Intergovernmental Panel on Climate Change. [Stocker, T.F., D. Qin, G.K. Plattner, M. Tignor, S.K. Allen, J. Boschung, A. Nauels, Y. Xia, V. Bex and P.M. Midgley (eds.)]. Cambridge University Press, Cambridge, United Kingdom and New York, NY, USA, 1535 pp.
2 IPCC (2021). Climate Change 2021: The Physical Science Basis. Contribution of Working Group I to the Sixth Assessment Report of the Intergovernmental Panel on Climate Change [Masson-Delmotte, V., P. Zhai, A. Pirani, S.L. Connors, C. Péan, S. Berger, N. Caud, Y. Chen, L. Goldfarb, M.I. Gomis, M. Huang, K. Leitzell, E. Lonnoy, J.B.R. Matthews, T.K. Maycock, T. Waterfield, O. Yelekçi, R. Yu, and B. Zhou (eds.)]. Cambridge University Press, Cambridge, United Kingdom and New York, NY, USA, 2391 pp.

Nitrous Oxide Emissions

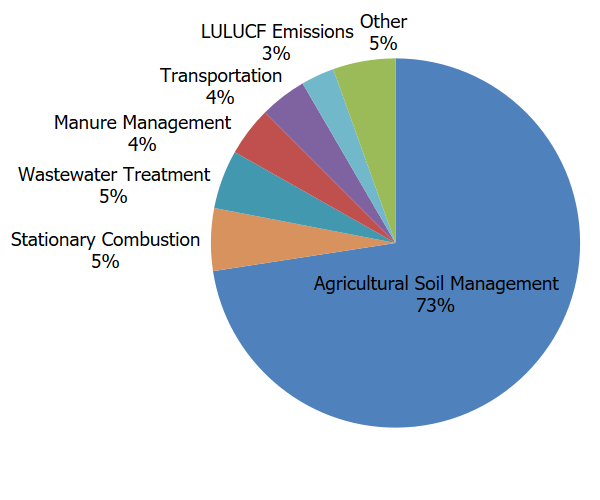
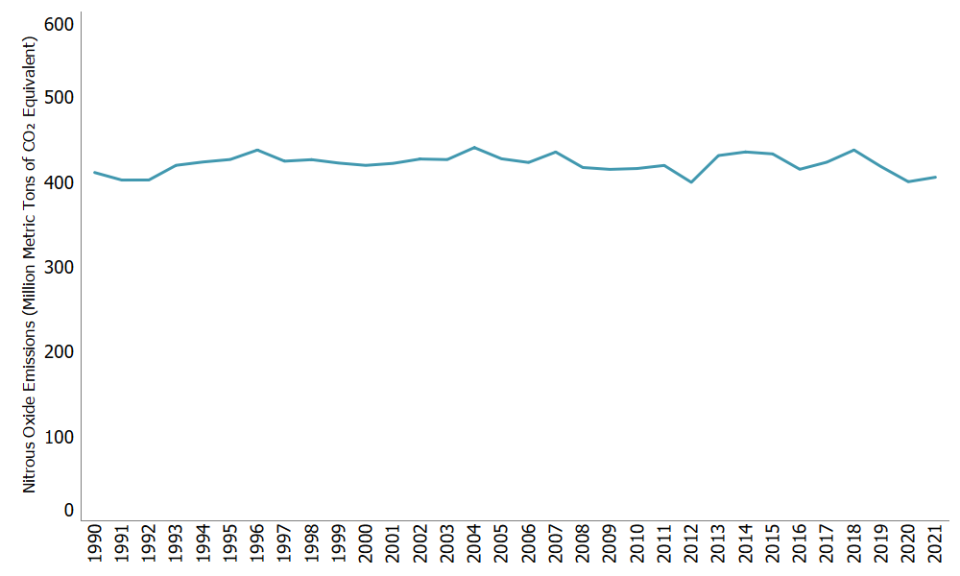
In 2021, nitrous oxide (N2O) accounted for 6% of all U.S. greenhouse gas emissions from human activities. Human activities such as agriculture, fuel combustion, wastewater management, and industrial processes are increasing the amount of N2O in the atmosphere. Nitrous oxide is also naturally present in the atmosphere as part of the Earth's nitrogen cycle and has a variety of natural sources. Nitrous oxide molecules stay in the atmosphere for an average of 121 years before being removed by a sink or destroyed through chemical reactions. The impact of 1 pound of N2O on warming the atmosphere is 265 times that of 1 pound of carbon dioxide.1

Globally, 40% of total N2O emissions come from human activities.2 Nitrous oxide is emitted from agriculture, land use, transportation, industry, and other activities, described below.

  • Agriculture. Nitrous oxide can result from various agricultural soil management activities, such as application of synthetic and organic fertilizers and other cropping practices, the management of manure, or burning of agricultural residues. Agricultural soil management is the largest source of N2O emissions in the United States, accounting for 75% of total U.S. N2O emissions in 2021. While not shown in the figure and less significant, emissions of N2O also occur as a result of land use and land management activities in the Land Use, Land-Use Change, and Forestry sector (e.g. forest and grassland fires, application of synthetic nitrogen fertilizers to urban soils (e.g., lawns, golf courses) and forest lands, etc.).
  • Fuel Combustion. Nitrous oxide is emitted when fuels are burned. The amount of N2O emitted from burning fuels depends on the type of fuel and combustion technology, maintenance, and operating practices.
  • Industry. Nitrous oxide is generated as a byproduct during the production of chemicals such as nitric acid, which is used to make synthetic commercial fertilizer, and in the production of adipic acid, which is used to make fibers, like nylon, and other synthetic products. Nitrous oxide is also emitted from use in other applications such as anesthesia and semiconductor manufacturing.
  • Waste. Nitrous oxide is also generated from treatment of domestic wastewater during nitrification and denitrification of the nitrogen present, usually in the form of urea, ammonia, and proteins.

Nitrous oxide emissions occur naturally through many sources associated with the nitrogen cycle, which is the natural circulation of nitrogen among the atmosphere, plants, animals, and microorganisms that live in soil and water. Nitrogen takes on a variety of chemical forms throughout the nitrogen cycle, including N2O. Natural emissions of N2O are mainly from bacteria breaking down nitrogen in soils and the oceans. Nitrous oxide is removed from the atmosphere when it is absorbed by certain types of bacteria or destroyed by ultraviolet radiation or chemical reactions.

To find out more about the sources of N2O and its role in warming the atmosphere, visit the Climate Change Indicators page.

Trends

Nitrous oxide emissions in the United States decreased by 3% between 1990 and 2021. During this time, nitrous oxide emissions from mobile combustion decreased by 56% as a result of criteria pollutant emission standards for on-road vehicles. Nitrous oxide emissions from agricultural soils have varied during this period and were about the same in 2021 as in 1990. 

Reducing Nitrous Oxide Emissions

There are a number of ways to reduce emissions of N2O, discussed below.

Examples of Reduction Opportunities for Nitrous Oxide Emissions
Emissions SourceExamples of How Emissions Can be Reduced
Agriculture

The application of nitrogen fertilizers accounts for the majority of N2O emissions in the United States. Emissions can be reduced by reducing nitrogen-based fertilizer applications and applying these fertilizers more efficiently,3 as well as modifying a farm's manure management practices.

Fuel Combustion
  • Nitrous oxide is a byproduct of fuel combustion, so reducing fuel consumption in motor vehicles and secondary sources can reduce emissions.
  • Additionally, the introduction of pollution control technologies (e.g., catalytic converters to reduce exhaust pollutants from passenger cars) can also reduce emissions of N2O.
Industry
  • Nitrous oxide is generally emitted from industry through fossil fuel combustion, so technological upgrades and fuel switching are effective ways to reduce industry emissions of N2O.
  • Production of nitric acid and adipic acid result in N2O emissions that can be reduced through technological upgrades and use of abatement equipment.

References

1IPCC (2013). Climate Change 2013: The Physical Science Basis. Contribution of Working Group I to the Fifth Assessment Report of the Intergovernmental Panel on Climate Change. [Stocker, T.F., D. Qin, G.K. Plattner, M. Tignor, S.K. Allen, J. Boschung, A. Nauels, Y. Xia, V. Bex and P.M. Midgley (eds.)]. Cambridge University Press, Cambridge, United Kingdom and New York, NY, USA, 1535 pp.
2IPCC (2021). Climate Change 2021: The Physical Science Basis. Contribution of Working Group I to the Sixth Assessment Report of the Intergovernmental Panel on Climate Change [Masson-Delmotte, V., P. Zhai, A. Pirani, S.L. Connors, C. Péan, S. Berger, N. Caud, Y. Chen, L. Goldfarb, M.I. Gomis, M. Huang, K. Leitzell, E. Lonnoy, J.B.R. Matthews, T.K. Maycock, T. Waterfield, O. Yelekçi, R. Yu, and B. Zhou (eds.)]. Cambridge University Press, Cambridge, United Kingdom and New York, NY, USA, 2391 pp.
3EPA (2005). Greenhouse Gas Mitigation Potential in U.S. Forestry and Agriculture. U.S. Environmental Protection Agency, Washington, DC, USA.

Emissions of Fluorinated Gases

Unlike many other greenhouse gases, fluorinated gases have no significant natural sources and come almost entirely from human-related activities. They are emitted through their use as substitutes for ozone-depleting substances (e.g., as refrigerants) and through a variety of industrial processes such as aluminum and semiconductor manufacturing. Many fluorinated gases have very high global warming potentials (GWPs) relative to other greenhouse gases, so small atmospheric concentrations can nevertheless have large effects on global temperatures. They can also have long atmospheric lifetimes—in some cases, lasting thousands of years. Like other long-lived greenhouse gases, most fluorinated gases are well-mixed in the atmosphere, spreading around the world after they are emitted. Many fluorinated gases are removed from the atmosphere only when they are destroyed by sunlight in the upper atmosphere. In general, fluorinated gases are the most potent and longest lasting type of greenhouse gases emitted by human activities.

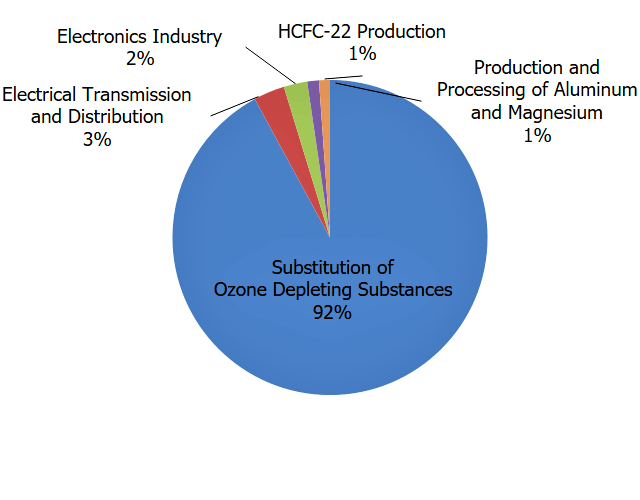
There are four main categories of fluorinated gases—hydrofluorocarbons (HFCs), perfluorocarbons (PFCs), sulfur hexafluoride (SF6), and nitrogen trifluoride (NF3). The largest sources of fluorinated gas emissions are described below.

  • Substitution for Ozone-Depleting SubstancesHydrofluorocarbons are used as refrigerants, aerosol propellants, foam blowing agents, solvents, and fire retardants. The major emissions source of these compounds is their use as refrigerants—for example, in air conditioning systems in both vehicles and buildings. These chemicals were developed as a replacement for chlorofluorocarbons (CFCs) and hydrochlorofluorocarbons (HCFCs) because they do not deplete the stratospheric ozone layer. CFCs and HCFCs are also greenhouse gases; however, their contribution is not included here because they are being phased out under an international agreement called the Montreal Protocol. HFCs are potent greenhouse gases with high GWPs, and they are released into the atmosphere during manufacturing processes and through leaks, servicing, and disposal of equipment in which they are used. Newly developed hydrofluoroolefins (HFOs) are a subset of HFCs and are characterized by short atmospheric lifetimes and lower GWPs. HFOs are currently being introduced as refrigerants, aerosol propellants and foam blowing agents. The American Innovation and Manufacturing (AIM) Act of 2020 directs EPA to address HFCs by providing new authorities in three main areas: to phase down the production and consumption of listed HFCs in the United States by 85% over the next 15 years, manage these HFCs and their substitutes, and facilitate the transition to next-generation technologies that do not rely on HFCs.
  • Industry. Perfluorocarbons are produced as a byproduct of aluminum production and are used in the manufacturing of semiconductors. PFCs generally have long atmospheric lifetimes and GWPs near 10,000. Sulfur hexafluoride is used in magnesium processing and semiconductor manufacturing, as well as a tracer gas for leak detection. Nitrogen trifluoride is used in semiconductor manufacturing. HFC-23 is produced as a byproduct of HCFC-22 production and is used in semiconductor manufacturing.
  • Transmission and Distribution of Electricity. Sulfur hexafluoride is used as an insulating gas in electrical transmission equipment, including circuit breakers. The GWP of SF6 is 23,500 making it the most potent greenhouse gas that the Intergovernmental Panel on Climate Change has evaluated.

To find out more about the role of fluorinated gases in warming the atmosphere and their sources, visit the Fluorinated Greenhouse Gas Emissions page.

Trends

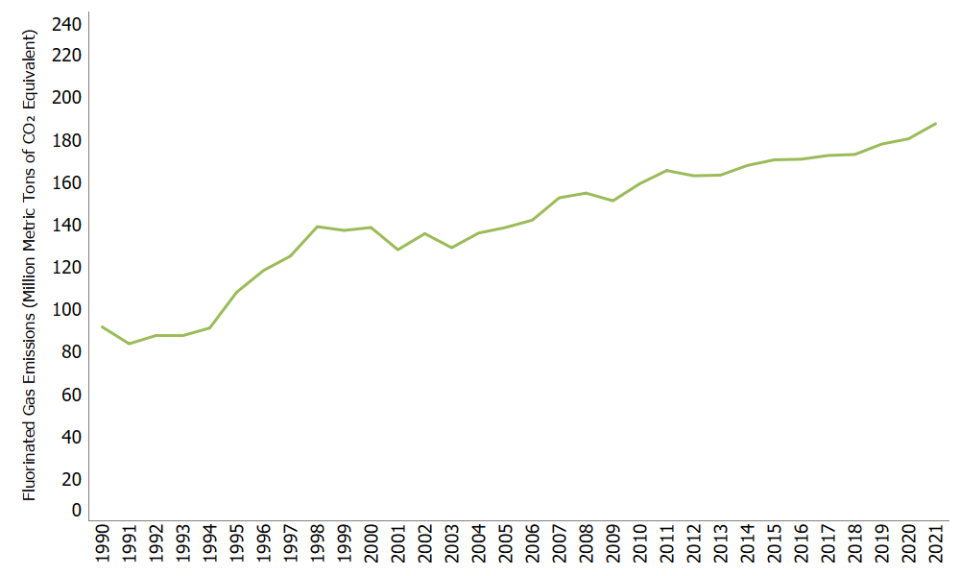
Overall, fluorinated gas emissions in the United States have increased by 105% between 1990 and 2021. This increase has been driven by a 349% increase in emissions of hydrofluorocarbons (HFCs) since 1990, as they have been widely used as a substitute for ozone-depleting substances. Emissions of perfluorocarbons (PFCs) and sulfur hexafluoride (SF6) have declined during this time due to emission-reduction efforts in the aluminum production industry (PFCs) and the electrical transmission and distribution industry (SF6).

Reducing Fluorinated Gas Emissions

Because most fluorinated gases have a very long atmospheric lifetime, it will take many years to see a noticeable decline in current concentrations. There are, however, a number of ways to reduce emissions of fluorinated gases, described below.

Examples of Reduction Opportunities for Fluorinated Gases
Emissions SourceExamples of How Emissions Can be Reduced
Substitution of Ozone-Depleting Substances in Homes and Businesses

Refrigerants used by businesses and residences emit fluorinated gases. Emissions can be reduced by better handling of these gases and use of substitutes with lower global warming potentials and other technological improvements. Visit EPA's Ozone Layer Protection site and HFC Phasedown site to learn more about reduction opportunities in this sector.

Industry

Industrial emitters of fluorinated gases can reduce emissions by adopting fluorinated gas capture and destruction processes, optimizing production to minimize emissions, and replacing these gases with alternatives. EPA has experience with these gases in the following sectors:

Electricity Transmission and Distribution

Sulfur hexafluoride is an extremely potent greenhouse gas that is used for several purposes when transmitting electricity through the power grid. EPA is working with industry to reduce emissions through the SF6 Emission Reduction Partnership for Electric Power Systems, which promotes leak detection and repair, use of recycling equipment, and consideration of alternative technologies that do not use SF6.

Transportation

Hydrofluorocarbons (HFCs) are released through the leakage of refrigerants used in vehicle air-conditioning systems. Leakage can be reduced through better system components and through the use of alternative refrigerants with lower global warming potentials than those presently used. EPA’s light-duty and heavy-duty vehicle standards provided incentives for manufacturers to produce vehicles with lower HFC emissions.

References

1IPCC (2013) Climate Change 2013: The Physical Science Basis. Contribution of Working Group I to the Fifth Assessment Report of the Intergovernmental Panel on Climate Change. [Stocker, T.F., D. Qin, G.K. Plattner, M. Tignor, S.K. Allen, J. Boschung, A. Nauels, Y. Xia, V. Bex and P.M. Midgley (eds.)]. Cambridge University Press, Cambridge, United Kingdom and New York, NY, USA, 1535 pp.


6,340 million metric tons of CO2: What does that mean?

An explanation of units:

A million metric tons equals about 2.2 billion pounds, or 1 trillion grams. For comparison, a small car is likely to weigh a little more than 1 metric ton. Thus, a million metric tons is roughly the same mass as 1 million small cars!

The U.S. Inventory uses metric units for consistency and comparability with other countries. For reference, a metric ton is slightly more (approximately 10%) than a U.S. "short" ton.

GHG emissions are often measured in carbon dioxide (CO2) equivalent. To convert emissions of a gas into CO2 equivalent, its emissions are multiplied by the gas's Global Warming Potential (GWP). The GWP takes into account the fact that many gases are more effective at warming Earth than CO2, per unit mass.

The GWP values appearing in the Overview of Greenhouse Gases and Sources of Greenhouse Gas web pages reflect the values used in the U.S. Inventory, which are drawn from the IPCC’s Fifth Assessment Report (AR5). For further discussion of GWPs and an estimate of GHG emissions using updated GWPs, see Annex 6 of the U.S. Inventory and the IPCC's discussion on GWPs (PDF) (151 pp, 14.2MB).