Trên thế giới, mọi người đều đổ lỗi cho việc tăng nhiệt độ toàn cầu là do CO2. Nhưng họ cứ nói một cách "cả vú lấp miệng em như vậy" - chứ tôi chưa tìm thấy một công trình khoa học nào chứng minh sự liên hệ mật thiết rõ ràng giữa CO2 và tăng nhiệt độ. Khi bạn khẳng định một chuyện gì đó, bạn cần chứng mình mối liên hệ rõ ràng. Những thứ không chứng minh được thì cần thêm chữ "thuyết" vào trước, như "thuyết tiến hóa", "thuyết nhân quả", "thuyết định mệnh", vân vân, mây mây...
Cứ cho rằng là CO2 là thủ phạm trực tiếp của hiện tượng tăng nhiệt độ toàn cầu, nhưng giải pháp là chuyển từ các loại động cơ xe xăng thành xe điện thì có thật sự là giải pháp không? Điện được sản xuất từ cái giống gì?
Overview of Greenhouse Gases
On this page:
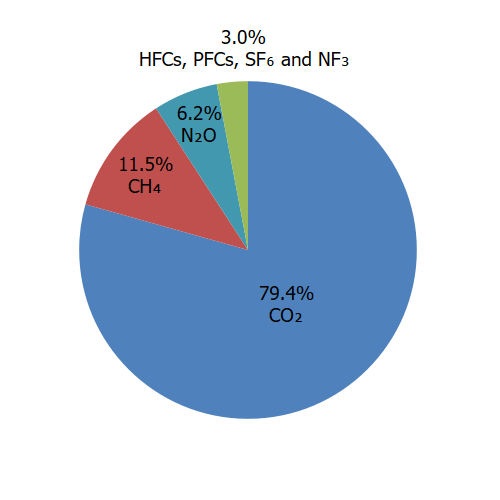
Image to save or print
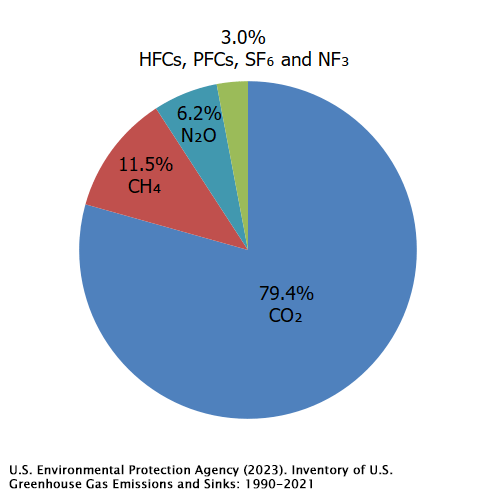
Gases that trap heat in the atmosphere are called greenhouse gases. This section provides information on emissions and removals of the main greenhouse gases to and from the atmosphere. For more information on the other climate forcers, such as black carbon, please visit the Climate Change Indicators: Climate Forcing page.
- Carbon dioxide (CO2): Carbon dioxide enters the atmosphere through burning fossil fuels (coal, natural gas, and oil), solid waste, trees and other biological materials, and also as a result of certain chemical reactions (e.g., cement production). Carbon dioxide is removed from the atmosphere (or "sequestered") when it is absorbed by plants as part of the biological carbon cycle.
- Methane (CH4): Methane is emitted during the production and transport of coal, natural gas, and oil. Methane emissions also result from livestock and other agricultural practices, land use, and by the decay of organic waste in municipal solid waste landfills.
- Nitrous oxide (N2O): Nitrous oxide is emitted during agricultural, land use, and industrial activities; combustion of fossil fuels and solid waste; as well as during treatment of wastewater.
- Fluorinated gases: Hydrofluorocarbons, perfluorocarbons, sulfur hexafluoride, and nitrogen trifluoride are synthetic, powerful greenhouse gases that are emitted from a variety of household, commercial, and industrial applications and processes. Fluorinated gases (especially hydrofluorocarbons) are sometimes used as substitutes for stratospheric ozone-depleting substances (e.g., chlorofluorocarbons, hydrochlorofluorocarbons, and halons). Fluorinated gases are typically emitted in smaller quantities than other greenhouse gases, but they are potent greenhouse gases. With global warming potentials (GWPs) that typically range from thousands to tens of thousands, they are sometimes referred to as high-GWP gases because, for a given amount of mass, they trap substantially more heat than CO2.
Each gas's effect on climate change depends on three main factors:
How abundant are greenhouse gases in the atmosphere?
Concentration, or abundance, is the amount of a particular gas in the air. Larger emissions of greenhouse gases lead to higher concentrations in the atmosphere. Greenhouse gas concentrations are measured in parts per million, parts per billion, and even parts per trillion. One part per million is equivalent to one drop of water diluted into about 13 gallons of liquid (roughly the fuel tank of a compact car). To learn more about the increasing concentrations of greenhouse gases in the atmosphere, visit the Climate Change Indicators: Atmospheric Concentrations of Greenhouse Gases page.
How long do greenhouse gases stay in the atmosphere?
Each of these gases can remain in the atmosphere for different amounts of time, ranging from a few years to thousands of years. All of these gases remain in the atmosphere long enough to become well mixed, meaning that the amount that is measured in the atmosphere is roughly the same all over the world, regardless of the source of the emissions.
How strongly do greenhouse gases impact the atmosphere?
Some gases are more effective than others at making the planet warmer and "thickening the Earth's atmospheric blanket."
For each greenhouse gas, a Global Warming Potential (GWP) was developed to allow comparisons of the global warming impacts of different gases. Specifically, it is a measure of how much energy the emissions of 1 ton of a gas will absorb over a given period of time, typically a 100-year time horizon, relative to the emissions of 1 ton of carbon dioxide (CO2). Gases with a higher GWP absorb more energy, per ton emitted, than gases with a lower GWP, and thus contribute more to warming Earth.
Note: All emission estimates are from the Inventory of U.S. Greenhouse Gas Emissions and Sinks: 1990–2021. The Inventory uses 100-year GWPs from IPCC’s Fifth Assessment Report (AR5).
Carbon Dioxide Emissions
Carbon dioxide (CO2) is the primary greenhouse gas emitted through human activities. In 2021, CO2 accounted for 79% of all U.S. greenhouse gas emissions from human activities. Carbon dioxide is naturally present in the atmosphere as part of the Earth's carbon cycle (the natural circulation of carbon among the atmosphere, oceans, soil, plants, and animals). Human activities are altering the carbon cycle–both by adding more CO2 to the atmosphere and by influencing the ability of natural sinks, like forests and soils, to remove and store CO2 from the atmosphere. While CO2 emissions come from a variety of natural sources, human-related emissions are responsible for the increase that has occurred in the atmosphere since the industrial revolution.2
Land Use, Land-Use Change, and Forestry in the United States is a net sink and offsets 12% of these greenhouse gas emissions. This net sink is not shown in the above diagram. All emission estimates from the Inventory of U.S. Greenhouse Gas Emissions and Sinks: 1990–2021.
Image to save or print
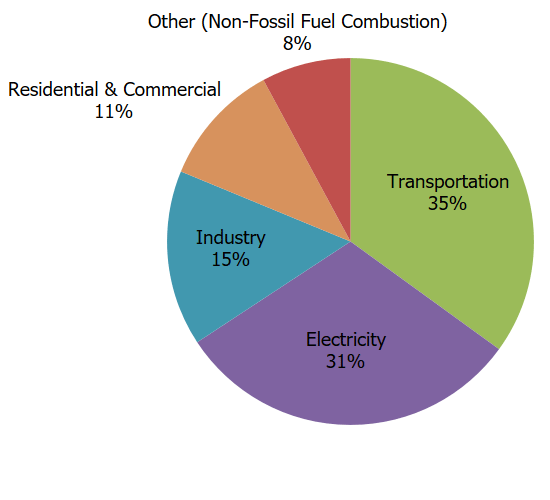
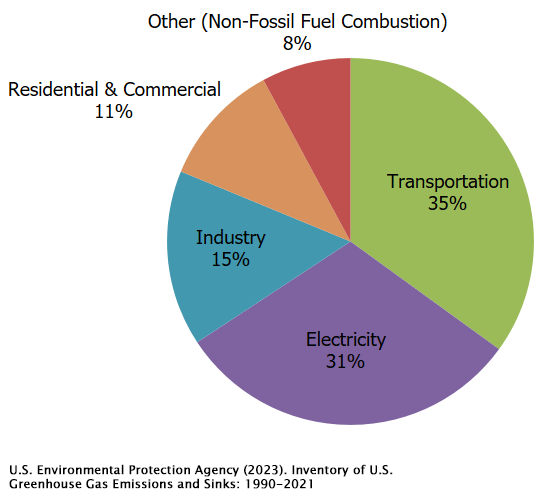
The main human activity that emits CO2 is the combustion of fossil fuels (coal, natural gas, and oil) for energy and transportation. Certain industrial processes and land-use changes also emit CO2. The main sources of CO2 emissions in the United States are described below.
- Transportation. The combustion of fossil fuels such as gasoline and diesel to transport people and goods was the largest source of CO2 emissions in 2021, accounting for 35% of total U.S. CO2 emissions and 28% of total U.S. greenhouse gas emissions. This category includes domestic transportation sources such as highway and passenger vehicles, air travel, marine transportation, and rail.
- Electricity. Electricity is a key source of energy in the United States and is used to power homes, business, and industry. In 2021, the combustion of fossil fuels to generate electricity was the second largest source of CO2 emissions in the nation, accounting for 31% of total U.S. CO2 emissions and 24% of total U.S. greenhouse gas emissions. The types of fossil fuel used to generate electricity emit different amounts of CO2. To produce a given amount of electricity, burning coal will produce more CO2 than natural gas or oil.
- Industry. Many industrial processes emit CO2 through fossil fuel consumption. Several processes also produce CO2 emissions through chemical reactions that do not involve combustion, and examples include the production of mineral products such as cement, the production of metals such as iron and steel, and the production of chemicals. The fossil fuel combustion component of various industrial processes accounted for 15% of total U.S. CO2 emissions and 12% of total U.S. greenhouse gas emissions in 2021. Many industrial processes also use electricity and therefore indirectly result in CO2 emissions from electricity generation.
Carbon dioxide is constantly being exchanged among the atmosphere, ocean, and land surface as it is both produced and absorbed by many microorganisms, plants, and animals. Emissions and removals of CO2 by these natural processes, however, tend to balance over time, absent anthropogenic impacts. Since the Industrial Revolution began around 1750, human activities have contributed substantially to climate change by adding CO2 and other heat-trapping gases to the atmosphere.
In the United States, the management of forests and other land (e.g., cropland, grasslands, etc.) has acted as a net sink of CO2, which means that more CO2 is removed from the atmosphere, and stored in plants and trees, than is emitted. This carbon sink offset about 13% of total emissions in 2021. For more details, see the discussion in the Land Use, Land-Use Change, and Forestry section.
To find out more about the role of CO2 in warming the atmosphere and its sources, visit the Climate Change Indicators page.
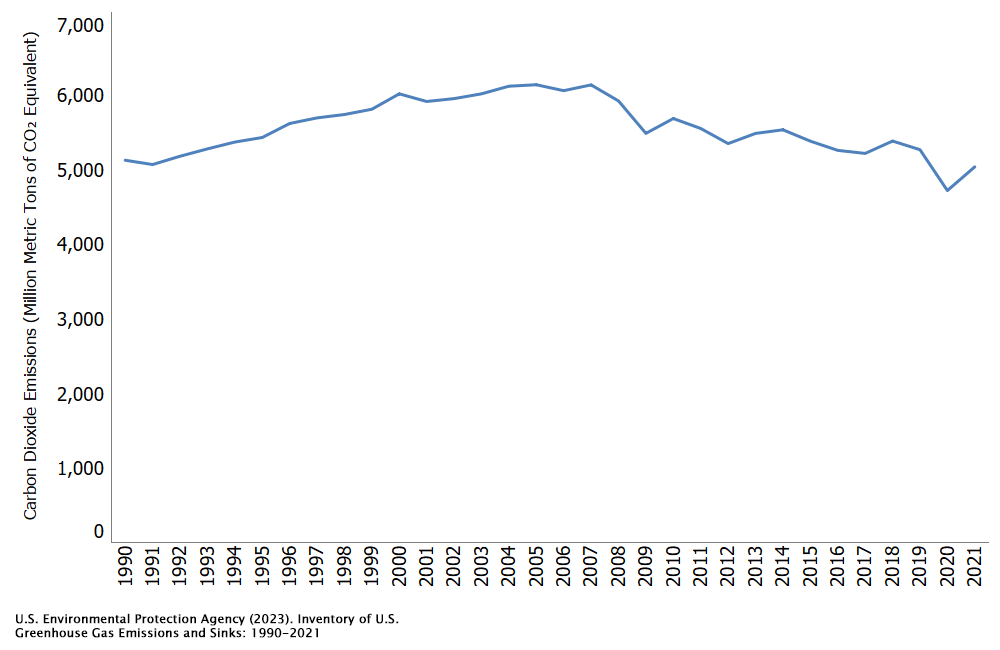
Trends
Carbon dioxide emissions in the United States decreased by 2% between 1990 and 2021. Since the combustion of fossil fuel is the largest source of greenhouse gas emissions in the United States, changes in emissions from fossil fuel combustion have historically been the dominant factor affecting total U.S. emission trends. Changes in CO2 emissions from fossil fuel combustion are influenced by many long-term and short-term factors, including population growth, economic growth, changing energy prices, new technologies, changing behavior, and seasonal temperatures. In 2021, the increase in CO2 emissions from fossil fuel combustion corresponded with an increase in energy use as a result of economic activity rebounding after the height of the COVID-19 pandemic, in addition to an increase in coal use in the electric power sector.
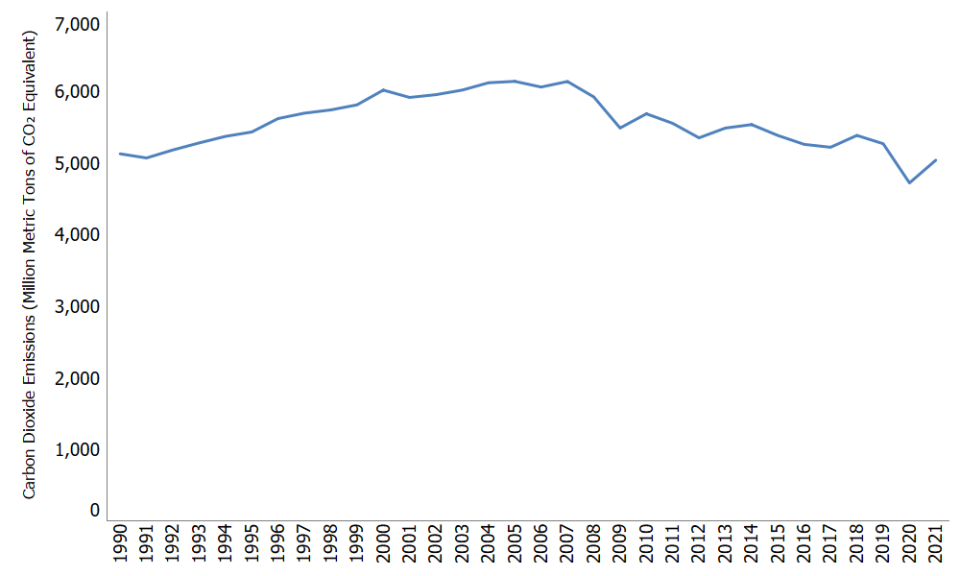
Image to save or print
Reducing Carbon Dioxide Emissions
The most effective way to reduce CO2 emissions is to reduce fossil fuel consumption. Many strategies for reducing CO2 emissions from energy are cross-cutting and apply to homes, businesses, industry, and transportation.
| Strategy | Examples of How Emissions Can be Reduced |
|---|---|
| Energy Efficiency | Improving the insulation of buildings, traveling in more fuel-efficient vehicles, and using more efficient electrical appliances are all ways to reduce energy use, and thus CO2 emissions.
|
| Energy Conservation | Reducing personal energy use by turning off lights and electronics when not in use reduces electricity demand. Reducing distance traveled in vehicles reduces petroleum consumption. Both are ways to reduce energy CO2 emissions through conservation. Learn more about What You Can Do at Home, at School, in the Office, and on the Road to save energy and reduce your carbon footprint. |
| Fuel Switching | Producing more energy from renewable sources and using fuels with lower carbon contents are ways to reduce carbon emissions. |
| Carbon Capture and Sequestration (CCS) | Carbon dioxide capture and sequestration is a set of technologies that can potentially greatly reduce CO2 emissions from new and existing coal- and gas-fired power plants, industrial processes, and other stationary sources of CO2. For example, a CCS project might capture CO2 from the stacks of a coal-fired power plant before it enters the atmosphere, transport the CO2 via pipeline, and inject the CO2 deep underground at a carefully selected and suitable subsurface geologic formation, such as a nearby abandoned oil field, where it is securely stored. |
| Changes in Uses of Land and Land Management Practices | Learn more about Land Use, Land Use Change and Forestry Sector. |
1 Atmospheric CO2 is part of the global carbon cycle, and therefore its fate is a complex function of geochemical and biological processes. Some of the excess carbon dioxide will be absorbed quickly (for example, by the ocean surface), but some will remain in the atmosphere for thousands of years, due in part to the very slow process by which carbon is transferred to ocean sediments.
2IPCC (2021). Climate Change 2021: The Physical Science Basis. Contribution of Working Group I to the Sixth Assessment Report of the Intergovernmental Panel on Climate Change [Masson-Delmotte, V., P. Zhai, A. Pirani, S.L. Connors, C. Péan, S. Berger, N. Caud, Y. Chen, L. Goldfarb, M.I. Gomis, M. Huang, K. Leitzell, E. Lonnoy, J.B.R. Matthews, T.K. Maycock, T. Waterfield, O. Yelekçi, R. Yu, and B. Zhou (eds.)]. Cambridge University Press, Cambridge, United Kingdom and New York, NY, USA, 2391 pp.
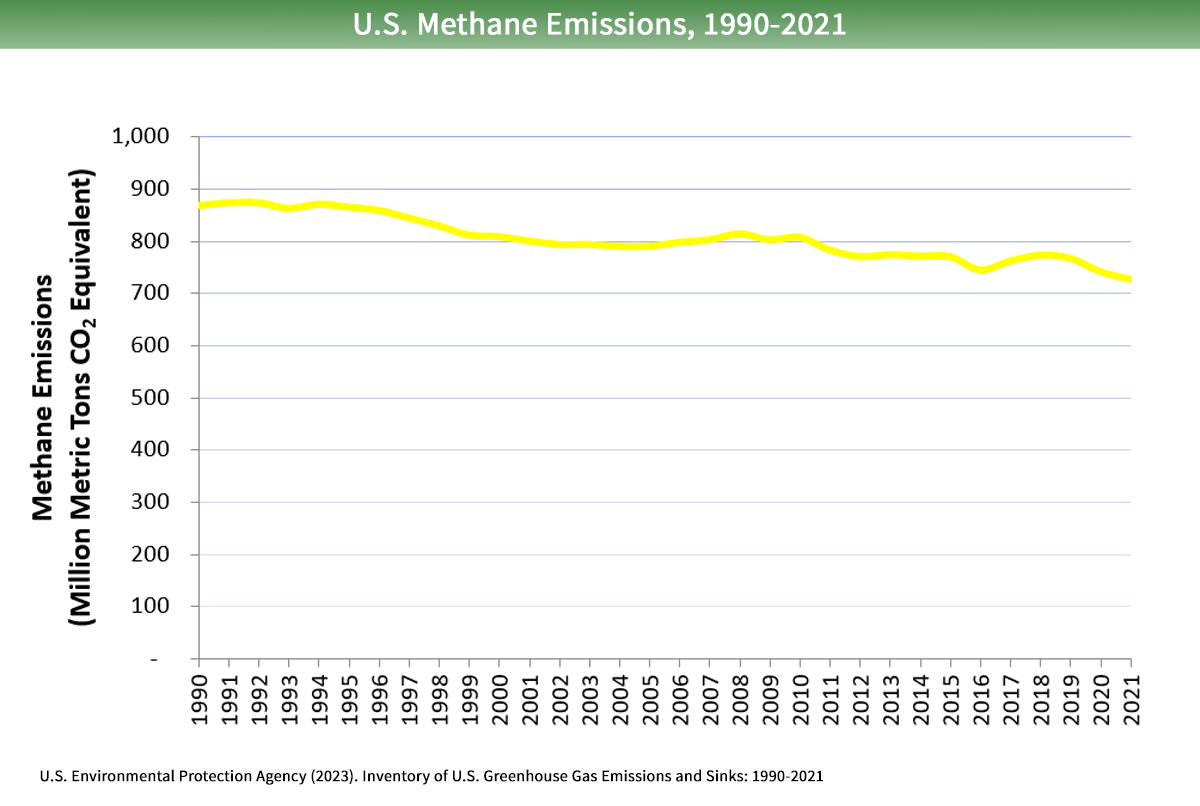
Methane Emissions
In 2021, methane (CH4) accounted for 12% of all U.S. greenhouse gas emissions from human activities. Human activities emitting methane include leaks from natural gas systems and the raising of livestock. Methane is also emitted by natural sources such as termites. In addition, natural processes in soil and chemical reactions in the atmosphere help remove CH4 from the atmosphere. Methane's lifetime in the atmosphere is much shorter than carbon dioxide (CO2), but CH4 is more efficient at trapping radiation than CO2. Pound for pound, the comparative impact of CH4 is 28 times greater than CO2 over a 100-year period.1
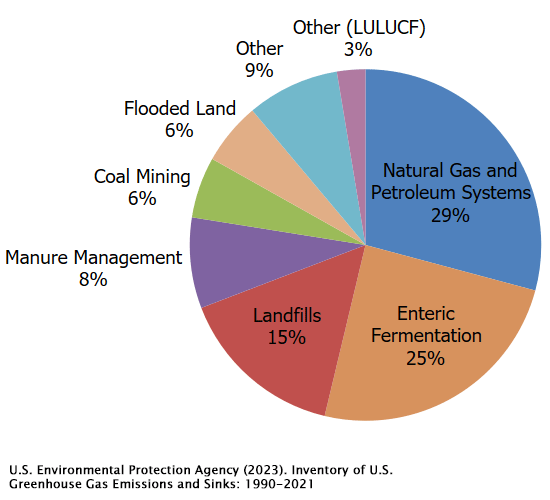
Globally, 50-65% of total CH4 emissions come from human activities.2 Methane is emitted from energy, industry, agriculture, land use, and waste management activities, described below.
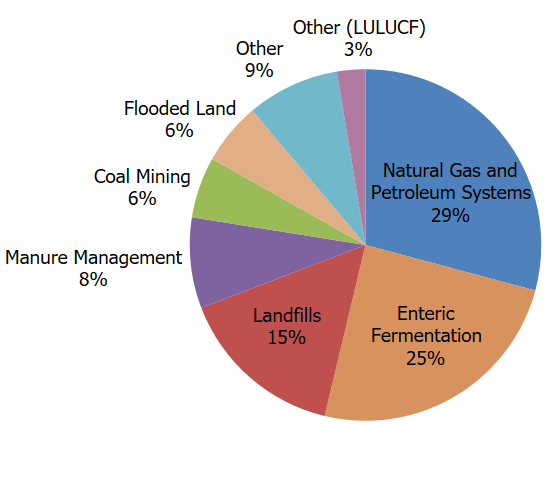
Image to save or print
- Agriculture. Domestic livestock such as cattle, swine, sheep, and goats produce CH4 as part of their normal digestive process. Also, when animal manure is stored or managed in lagoons or holding tanks, CH4 is produced. Because humans raise these animals for food and other products, the emissions are considered human-related. The Agriculture sector is the largest source of CH4 emissions in the United States. For more information, see the Inventory of U.S. Greenhouse Gas Emissions and Sinks Agriculture chapter.
- LULUCF: While not shown in the figure, emissions of CH4 also occur as a result of land use and land management activities in the Land Use, Land-Use Change, and Forestry sector (e.g. forest and grassland fires, management of flooded lands such as reservoirs, decomposition of organic matter in coastal wetlands).
- Energy and Industry. Natural gas and petroleum systems are the second largest source of CH4 emissions in the United States. Methane is emitted to the atmosphere during the production, processing, storage, transmission, distribution, and use of natural gas, and the production, refinement, transportation, and storage of crude oil. Coal mining is also a source of CH4 emissions. For more information, see the Inventory of U.S. Greenhouse Gas Emissions and Sinks sections on Natural Gas Systems and Petroleum Systems.
- Waste from Homes and Businesses. Methane is generated in landfills as waste decomposes and in the treatment of wastewater. Landfills are the third-largest source of CH4 emissions in the United States. Methane is also generated from domestic and industrial wastewater treatment and from composting and anaerobic digestion. For more information, see the Inventory of U.S. Greenhouse Gas Emissions and Sinks Waste chapter.
Methane is also emitted from a number of natural sources. Natural wetlands that are not managed or changed by human activity are the largest source, emitting CH4 from bacteria that decompose organic materials in the absence of oxygen. Reservoirs and ponds with high organic matter and low oxygen levels also produce methane through the microbial breakdown of organic matter. Smaller sources include termites, oceans, sediments, volcanoes, and wildfires.
To find out more about the role of CH4 in warming the atmosphere and its sources, visit the Climate Change Indicators page.
Trends
Methane emissions in the United States decreased by 16% between 1990 and 2021. During this time period, emissions increased from sources associated with agricultural activities, while emissions decreased from other sources including landfills and coal mining and from natural gas and petroleum systems.
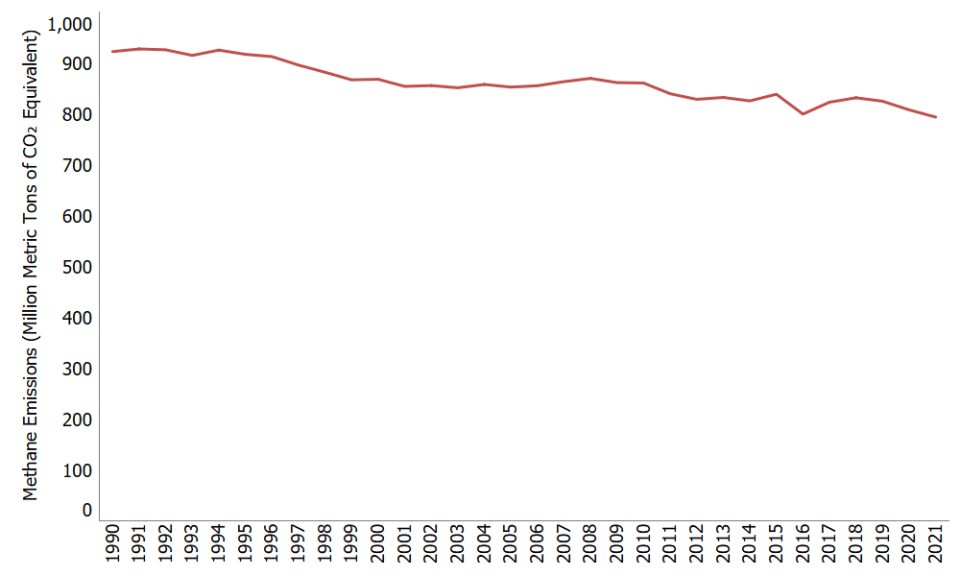
Image to save or print
Reducing Methane Emissions
There are a number of ways to reduce CH4 emissions. Some examples are discussed below. EPA has a series of voluntary programs for reducing CH4 emissions, in addition to regulatory initiatives. EPA also supports the Global Methane Initiative, an international partnership encouraging global methane reduction strategies.
| Emissions Source | How Emissions Can be Reduced |
|---|---|
| Industry | Upgrading the equipment used to produce, store, and transport oil and natural gas can reduce many of the leaks that contribute to CH4 emissions. Methane from coal mines can also be captured and used for energy. Learn more about the EPA's Natural Gas STAR Program and Coalbed Methane Outreach Program. |
| Agriculture | Methane from manure management practices can be reduced and captured by altering manure management strategies. Additionally, modifications to animal feeding practices may reduce emissions from enteric fermentation. Learn more about improved manure management practices at EPA's AgSTAR Program. |
| Waste from Homes and Businesses | Capturing landfill CH4 for destruction in a flare or conversion to renewable energy are both effective emission reduction strategies. Learn more about these opportunities and the EPA's Landfill Methane Outreach Program. Additionally, managing waste at a higher tier on the waste management hierarchy can reduce CH4 generation at landfills. Learn more about Sustainable Materials Management. |
References
1IPCC (2013). Climate Change 2013: The Physical Science Basis. Contribution of Working Group I to the Fifth Assessment Report of the Intergovernmental Panel on Climate Change. [Stocker, T.F., D. Qin, G.K. Plattner, M. Tignor, S.K. Allen, J. Boschung, A. Nauels, Y. Xia, V. Bex and P.M. Midgley (eds.)]. Cambridge University Press, Cambridge, United Kingdom and New York, NY, USA, 1535 pp.
2 IPCC (2021). Climate Change 2021: The Physical Science Basis. Contribution of Working Group I to the Sixth Assessment Report of the Intergovernmental Panel on Climate Change [Masson-Delmotte, V., P. Zhai, A. Pirani, S.L. Connors, C. Péan, S. Berger, N. Caud, Y. Chen, L. Goldfarb, M.I. Gomis, M. Huang, K. Leitzell, E. Lonnoy, J.B.R. Matthews, T.K. Maycock, T. Waterfield, O. Yelekçi, R. Yu, and B. Zhou (eds.)]. Cambridge University Press, Cambridge, United Kingdom and New York, NY, USA, 2391 pp.
Nitrous Oxide Emissions
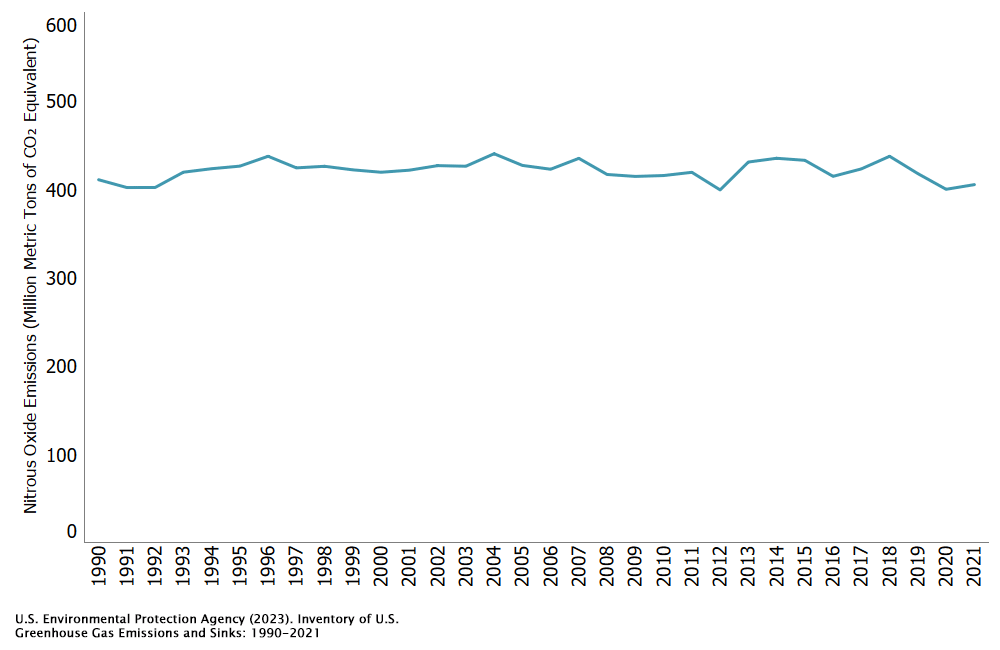
In 2021, nitrous oxide (N2O) accounted for 6% of all U.S. greenhouse gas emissions from human activities. Human activities such as agriculture, fuel combustion, wastewater management, and industrial processes are increasing the amount of N2O in the atmosphere. Nitrous oxide is also naturally present in the atmosphere as part of the Earth's nitrogen cycle and has a variety of natural sources. Nitrous oxide molecules stay in the atmosphere for an average of 121 years before being removed by a sink or destroyed through chemical reactions. The impact of 1 pound of N2O on warming the atmosphere is 265 times that of 1 pound of carbon dioxide.1
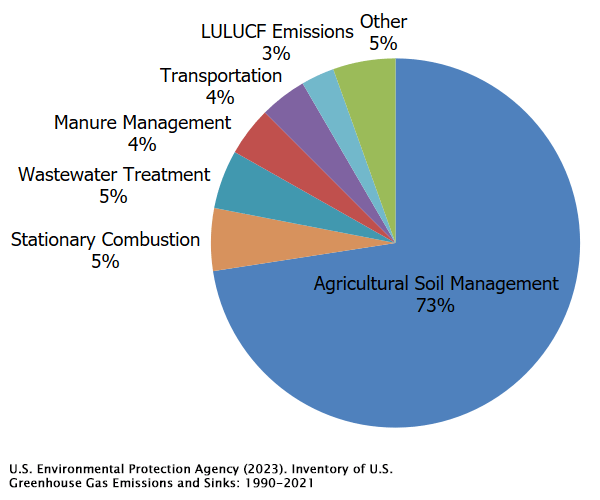
Globally, 40% of total N2O emissions come from human activities.2 Nitrous oxide is emitted from agriculture, land use, transportation, industry, and other activities, described below.
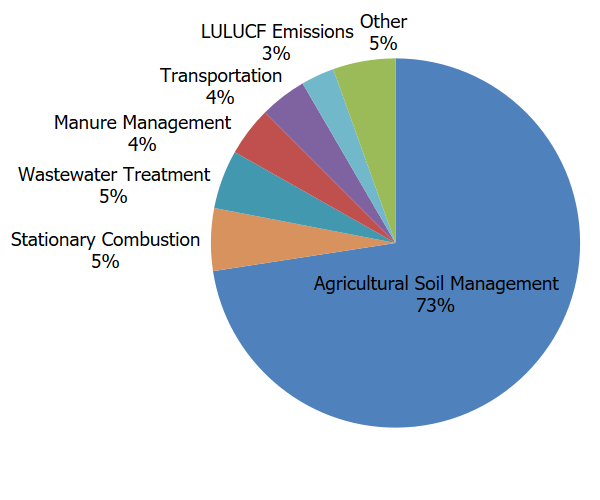
Image to save or print
- Agriculture. Nitrous oxide can result from various agricultural soil management activities, such as application of synthetic and organic fertilizers and other cropping practices, the management of manure, or burning of agricultural residues. Agricultural soil management is the largest source of N2O emissions in the United States, accounting for 75% of total U.S. N2O emissions in 2021. While not shown in the figure and less significant, emissions of N2O also occur as a result of land use and land management activities in the Land Use, Land-Use Change, and Forestry sector (e.g. forest and grassland fires, application of synthetic nitrogen fertilizers to urban soils (e.g., lawns, golf courses) and forest lands, etc.).
- Fuel Combustion. Nitrous oxide is emitted when fuels are burned. The amount of N2O emitted from burning fuels depends on the type of fuel and combustion technology, maintenance, and operating practices.
- Industry. Nitrous oxide is generated as a byproduct during the production of chemicals such as nitric acid, which is used to make synthetic commercial fertilizer, and in the production of adipic acid, which is used to make fibers, like nylon, and other synthetic products. Nitrous oxide is also emitted from use in other applications such as anesthesia and semiconductor manufacturing.
- Waste. Nitrous oxide is also generated from treatment of domestic wastewater during nitrification and denitrification of the nitrogen present, usually in the form of urea, ammonia, and proteins.
Nitrous oxide emissions occur naturally through many sources associated with the nitrogen cycle, which is the natural circulation of nitrogen among the atmosphere, plants, animals, and microorganisms that live in soil and water. Nitrogen takes on a variety of chemical forms throughout the nitrogen cycle, including N2O. Natural emissions of N2O are mainly from bacteria breaking down nitrogen in soils and the oceans. Nitrous oxide is removed from the atmosphere when it is absorbed by certain types of bacteria or destroyed by ultraviolet radiation or chemical reactions.
To find out more about the sources of N2O and its role in warming the atmosphere, visit the Climate Change Indicators page.
Trends
Nitrous oxide emissions in the United States decreased by 3% between 1990 and 2021. During this time, nitrous oxide emissions from mobile combustion decreased by 56% as a result of criteria pollutant emission standards for on-road vehicles. Nitrous oxide emissions from agricultural soils have varied during this period and were about the same in 2021 as in 1990.
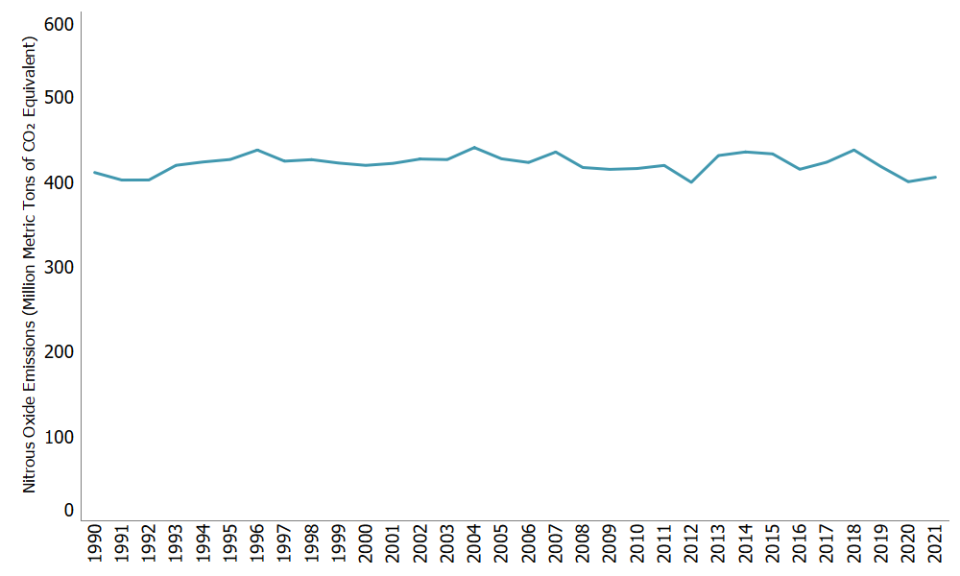
Image to save or print
Reducing Nitrous Oxide Emissions
There are a number of ways to reduce emissions of N2O, discussed below.
| Emissions Source | Examples of How Emissions Can be Reduced |
|---|---|
| Agriculture | The application of nitrogen fertilizers accounts for the majority of N2O emissions in the United States. Emissions can be reduced by reducing nitrogen-based fertilizer applications and applying these fertilizers more efficiently,3 as well as modifying a farm's manure management practices. |
| Fuel Combustion |
|
| Industry |
|
References
1IPCC (2013). Climate Change 2013: The Physical Science Basis. Contribution of Working Group I to the Fifth Assessment Report of the Intergovernmental Panel on Climate Change. [Stocker, T.F., D. Qin, G.K. Plattner, M. Tignor, S.K. Allen, J. Boschung, A. Nauels, Y. Xia, V. Bex and P.M. Midgley (eds.)]. Cambridge University Press, Cambridge, United Kingdom and New York, NY, USA, 1535 pp.
2IPCC (2021). Climate Change 2021: The Physical Science Basis. Contribution of Working Group I to the Sixth Assessment Report of the Intergovernmental Panel on Climate Change [Masson-Delmotte, V., P. Zhai, A. Pirani, S.L. Connors, C. Péan, S. Berger, N. Caud, Y. Chen, L. Goldfarb, M.I. Gomis, M. Huang, K. Leitzell, E. Lonnoy, J.B.R. Matthews, T.K. Maycock, T. Waterfield, O. Yelekçi, R. Yu, and B. Zhou (eds.)]. Cambridge University Press, Cambridge, United Kingdom and New York, NY, USA, 2391 pp.
3EPA (2005). Greenhouse Gas Mitigation Potential in U.S. Forestry and Agriculture. U.S. Environmental Protection Agency, Washington, DC, USA.
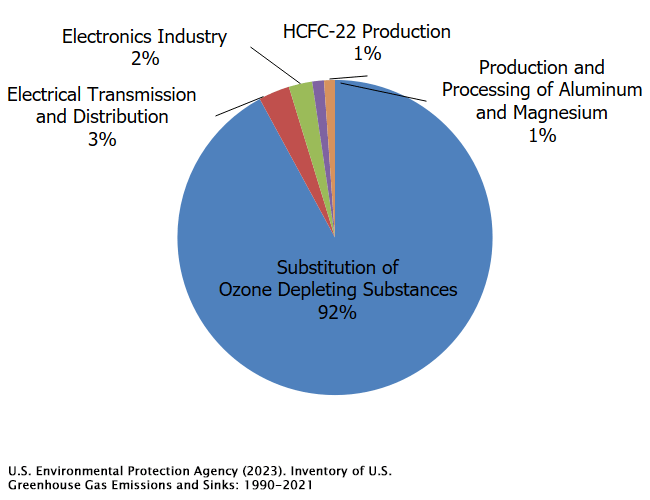
Emissions of Fluorinated Gases
Unlike many other greenhouse gases, fluorinated gases have no significant natural sources and come almost entirely from human-related activities. They are emitted through their use as substitutes for ozone-depleting substances (e.g., as refrigerants) and through a variety of industrial processes such as aluminum and semiconductor manufacturing. Many fluorinated gases have very high global warming potentials (GWPs) relative to other greenhouse gases, so small atmospheric concentrations can nevertheless have large effects on global temperatures. They can also have long atmospheric lifetimes—in some cases, lasting thousands of years. Like other long-lived greenhouse gases, most fluorinated gases are well-mixed in the atmosphere, spreading around the world after they are emitted. Many fluorinated gases are removed from the atmosphere only when they are destroyed by sunlight in the upper atmosphere. In general, fluorinated gases are the most potent and longest lasting type of greenhouse gases emitted by human activities.
There are four main categories of fluorinated gases—hydrofluorocarbons (HFCs), perfluorocarbons (PFCs), sulfur hexafluoride (SF6), and nitrogen trifluoride (NF3). The largest sources of fluorinated gas emissions are described below.
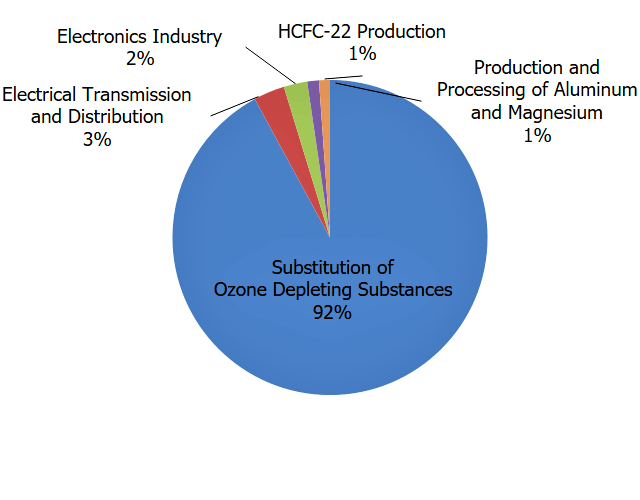
Image to save or print
- Substitution for Ozone-Depleting Substances. Hydrofluorocarbons are used as refrigerants, aerosol propellants, foam blowing agents, solvents, and fire retardants. The major emissions source of these compounds is their use as refrigerants—for example, in air conditioning systems in both vehicles and buildings. These chemicals were developed as a replacement for chlorofluorocarbons (CFCs) and hydrochlorofluorocarbons (HCFCs) because they do not deplete the stratospheric ozone layer. CFCs and HCFCs are also greenhouse gases; however, their contribution is not included here because they are being phased out under an international agreement called the Montreal Protocol. HFCs are potent greenhouse gases with high GWPs, and they are released into the atmosphere during manufacturing processes and through leaks, servicing, and disposal of equipment in which they are used. Newly developed hydrofluoroolefins (HFOs) are a subset of HFCs and are characterized by short atmospheric lifetimes and lower GWPs. HFOs are currently being introduced as refrigerants, aerosol propellants and foam blowing agents. The American Innovation and Manufacturing (AIM) Act of 2020 directs EPA to address HFCs by providing new authorities in three main areas: to phase down the production and consumption of listed HFCs in the United States by 85% over the next 15 years, manage these HFCs and their substitutes, and facilitate the transition to next-generation technologies that do not rely on HFCs.
- Industry. Perfluorocarbons are produced as a byproduct of aluminum production and are used in the manufacturing of semiconductors. PFCs generally have long atmospheric lifetimes and GWPs near 10,000. Sulfur hexafluoride is used in magnesium processing and semiconductor manufacturing, as well as a tracer gas for leak detection. Nitrogen trifluoride is used in semiconductor manufacturing. HFC-23 is produced as a byproduct of HCFC-22 production and is used in semiconductor manufacturing.
- Transmission and Distribution of Electricity. Sulfur hexafluoride is used as an insulating gas in electrical transmission equipment, including circuit breakers. The GWP of SF6 is 23,500 making it the most potent greenhouse gas that the Intergovernmental Panel on Climate Change has evaluated.
To find out more about the role of fluorinated gases in warming the atmosphere and their sources, visit the Fluorinated Greenhouse Gas Emissions page.
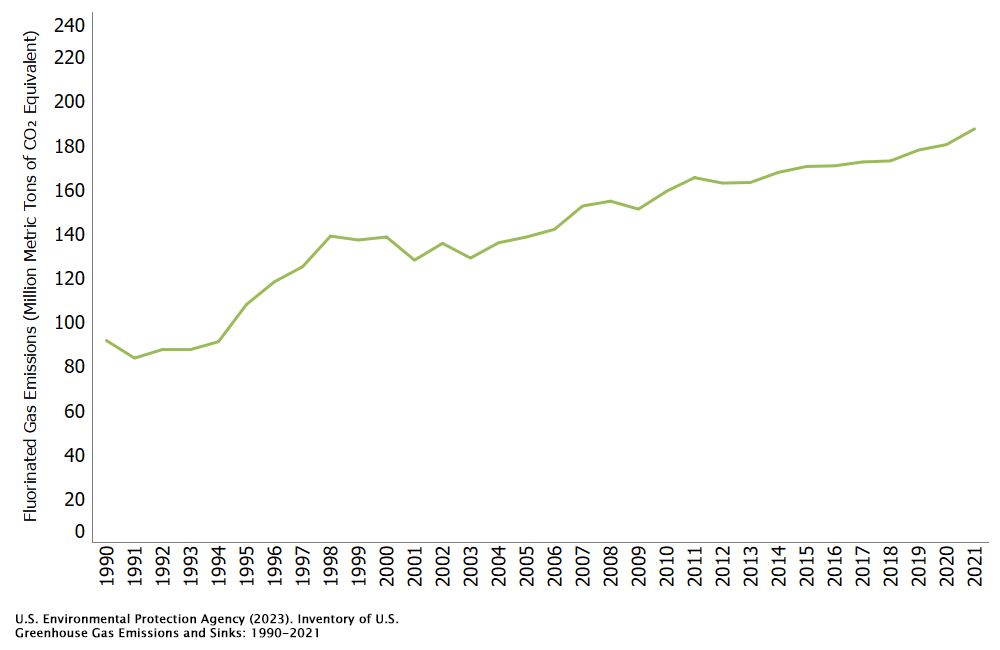
Trends
Overall, fluorinated gas emissions in the United States have increased by 105% between 1990 and 2021. This increase has been driven by a 349% increase in emissions of hydrofluorocarbons (HFCs) since 1990, as they have been widely used as a substitute for ozone-depleting substances. Emissions of perfluorocarbons (PFCs) and sulfur hexafluoride (SF6) have declined during this time due to emission-reduction efforts in the aluminum production industry (PFCs) and the electrical transmission and distribution industry (SF6).
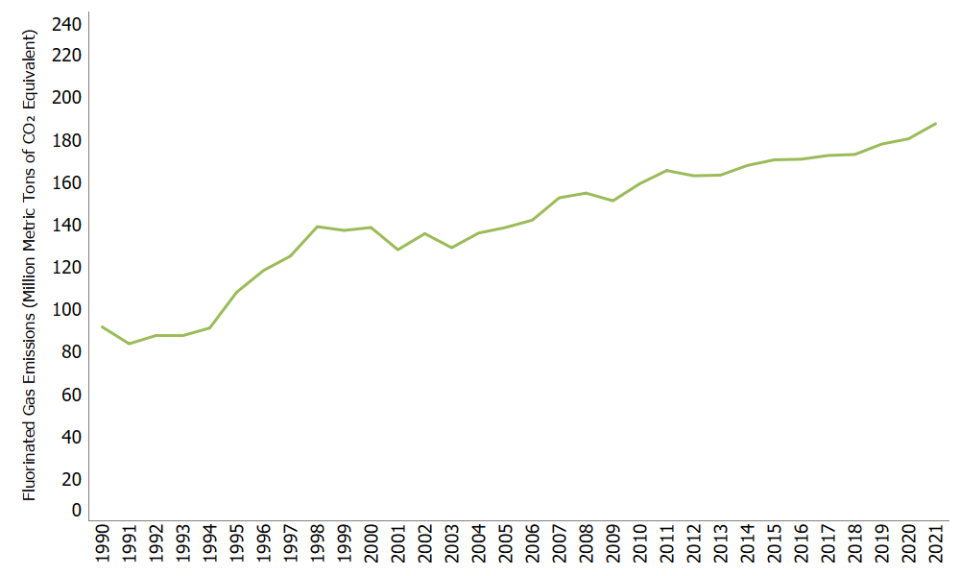
Image to save or print
Reducing Fluorinated Gas Emissions
Because most fluorinated gases have a very long atmospheric lifetime, it will take many years to see a noticeable decline in current concentrations. There are, however, a number of ways to reduce emissions of fluorinated gases, described below.
| Emissions Source | Examples of How Emissions Can be Reduced |
|---|---|
| Substitution of Ozone-Depleting Substances in Homes and Businesses | Refrigerants used by businesses and residences emit fluorinated gases. Emissions can be reduced by better handling of these gases and use of substitutes with lower global warming potentials and other technological improvements. Visit EPA's Ozone Layer Protection site and HFC Phasedown site to learn more about reduction opportunities in this sector. |
| Industry | Industrial emitters of fluorinated gases can reduce emissions by adopting fluorinated gas capture and destruction processes, optimizing production to minimize emissions, and replacing these gases with alternatives. EPA has experience with these gases in the following sectors: |
| Electricity Transmission and Distribution | Sulfur hexafluoride is an extremely potent greenhouse gas that is used for several purposes when transmitting electricity through the power grid. EPA is working with industry to reduce emissions through the SF6 Emission Reduction Partnership for Electric Power Systems, which promotes leak detection and repair, use of recycling equipment, and consideration of alternative technologies that do not use SF6. |
| Transportation | Hydrofluorocarbons (HFCs) are released through the leakage of refrigerants used in vehicle air-conditioning systems. Leakage can be reduced through better system components and through the use of alternative refrigerants with lower global warming potentials than those presently used. EPA’s light-duty and heavy-duty vehicle standards provided incentives for manufacturers to produce vehicles with lower HFC emissions. |
References
1IPCC (2013) Climate Change 2013: The Physical Science Basis. Contribution of Working Group I to the Fifth Assessment Report of the Intergovernmental Panel on Climate Change. [Stocker, T.F., D. Qin, G.K. Plattner, M. Tignor, S.K. Allen, J. Boschung, A. Nauels, Y. Xia, V. Bex and P.M. Midgley (eds.)]. Cambridge University Press, Cambridge, United Kingdom and New York, NY, USA, 1535 pp.
The GWP values appearing in the Overview of Greenhouse Gases and Sources of Greenhouse Gas web pages reflect the values used in the U.S. Inventory, which are drawn from the IPCC’s Fifth Assessment Report (AR5). For further discussion of GWPs and an estimate of GHG emissions using updated GWPs, see Annex 6 of the U.S. Inventory and the IPCC's discussion on GWPs (PDF) (151 pp, 14.2MB).
Không có nhận xét nào:
Đăng nhận xét